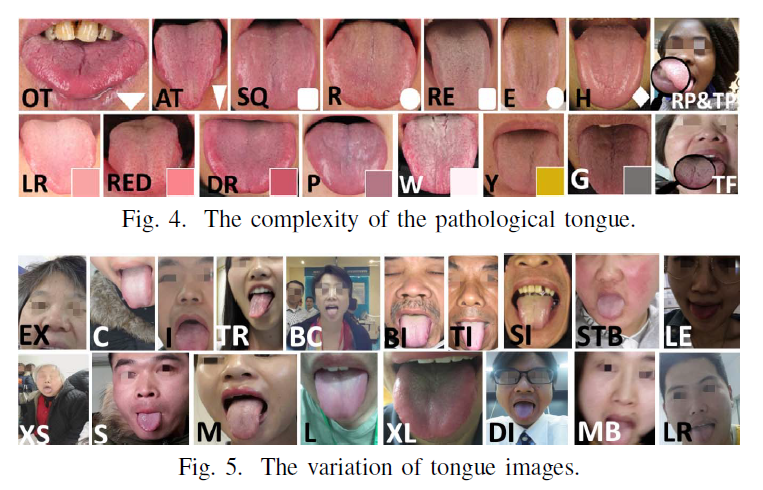
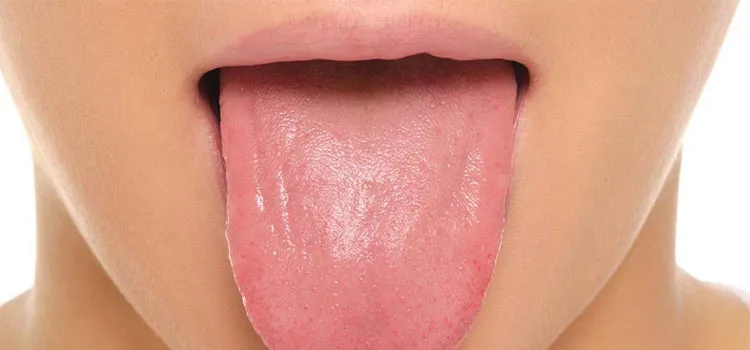
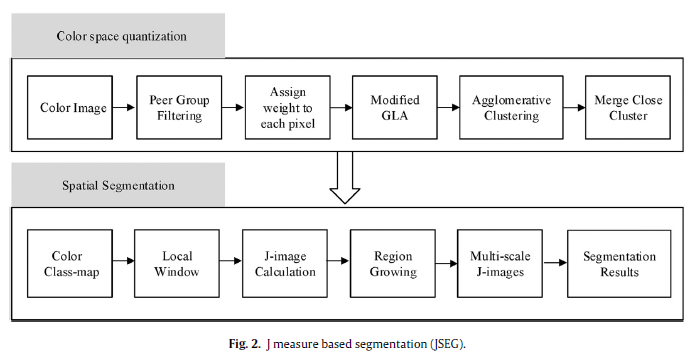
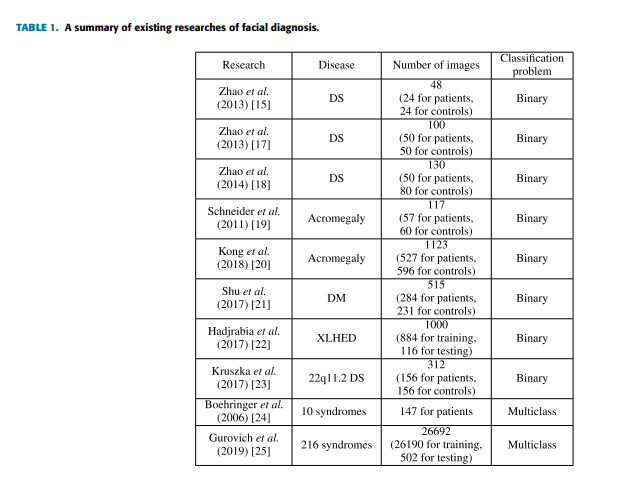
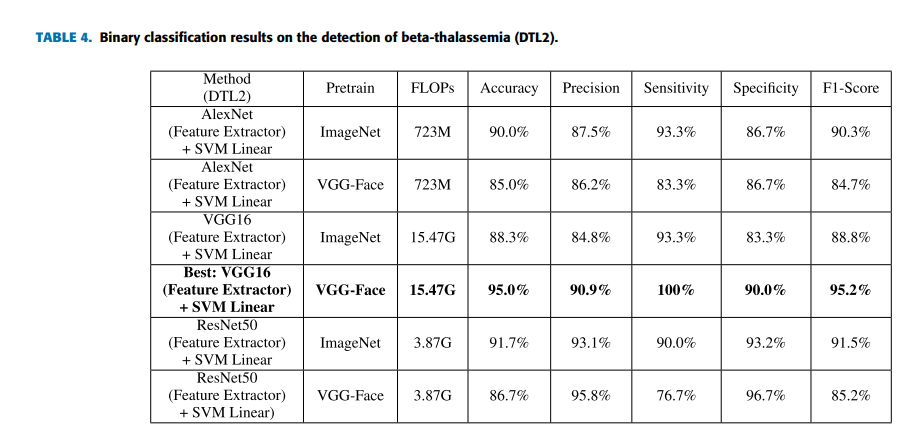
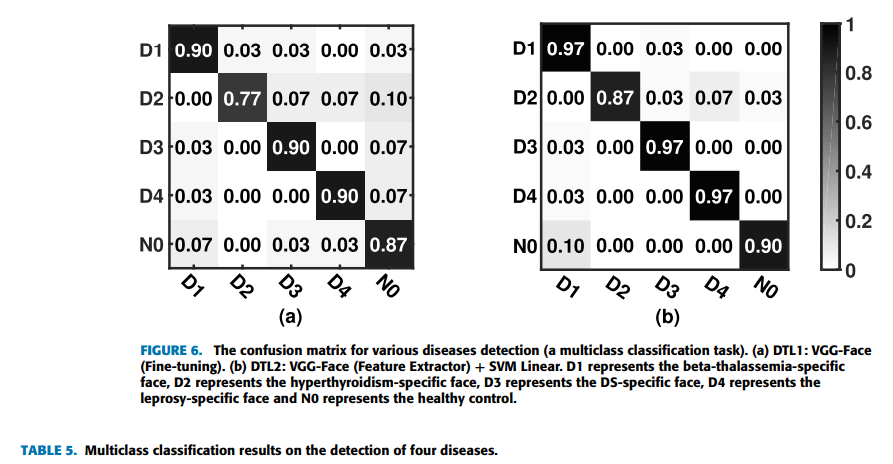
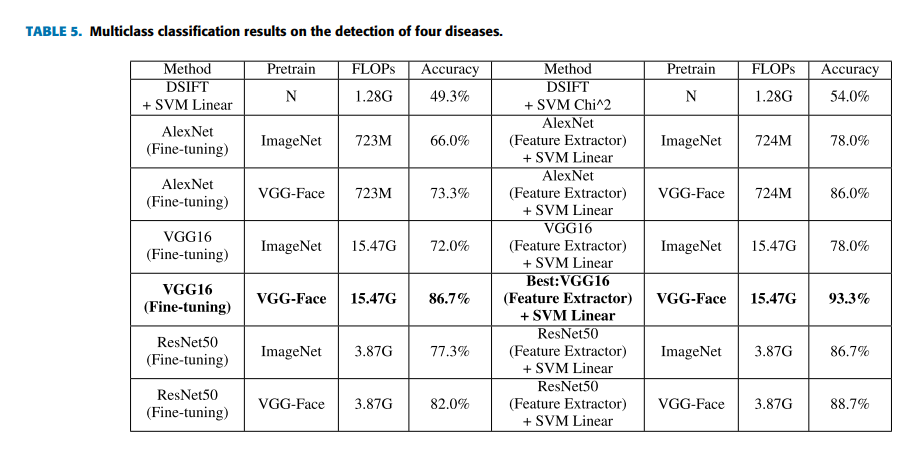
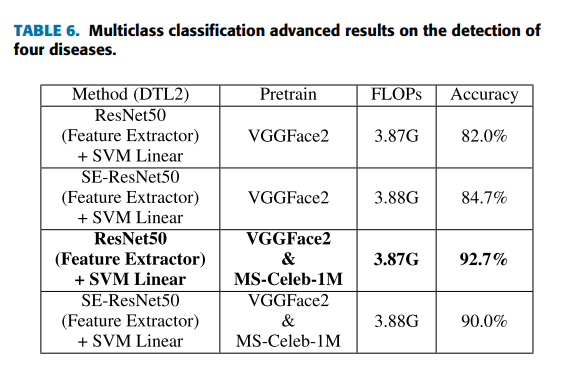
Geographic Tongue


People with geographic tongue have smooth, reddish patches surrounded by white borders on their tongues. It’s a harmless, non-contagious condition. However, if you feel pain or discomfort on your tongue, take pain relievers and avoid the foods that trigger the pain.

What is geographic tongue?

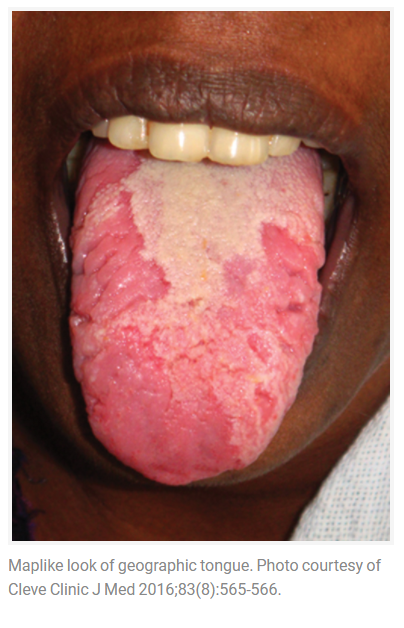
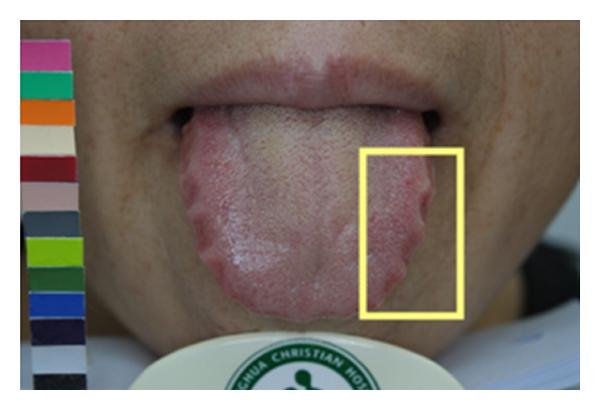
Geographic tongue is a condition that causes a map-like pattern to appear on the tongue. People with this condition have smooth, reddish patches surrounded by white borders on their tongues. The red areas are missing the tiny bumps (papillae) that naturally appear on the surface of the tongue.

Geographic tongue is benign (harmless) and does not cause any long-term health problems. It is not contagious. Most people have no symptoms, but some people feel a burning or stinging sensation on their tongue. Treatment for geographic tongue usually isn’t necessary.

How common is geographic tongue?

Doctors aren’t sure how many people have geographic tongue. Some doctors estimate that about 3% of the population has the condition, but it may occur more frequently.

Who is affected by geographic tongue?

Geographic tongue (also called benign migratory glossitis) is slightly more common in young adults, though doctors aren’t sure why. People who have psoriasis (a condition that causes scaly patches on the skin) and reactive arthritis (Reiter’s syndrome) are more likely than others to have geographic tongue. The condition appears in people of all ages, including babies and children.

How do people get geographic tongue?

Doctors aren’t sure what causes geographic tongue, but they do know that it is not contagious. Because it often runs in families, doctors believe it may be inherited (passed down) from parents to their children.

People commonly have other conditions along with geographic tongue. These conditions and diseases include:

  • Psoriasis: Many people with geographic tongue also have psoriasis, an inflammatory skin condition.
  • Hormonal surges: Women who are taking oral contraceptives (birth control pills) have developed geographic tongue, possibly due to the female hormones in the pills.
  • Vitamin deficiencies: People who don’t have enough zinc, iron, folic acid and vitamins B6 and B12 are more likely to have geographic tongue.
  • Fissured tongue: Doctors think there might be a genetic link between geographic tongue and fissured tongue, a condition that causes deep grooves or wrinkles on the tongue.
  • Diabetes: Some doctors have found that people with diabetes, especially type 1 diabetes, have a higher chance of developing geographic tongue.
  • Allergies: People with eczema, hay fever and other allergies may have an increased chance of having the condition.
  • Emotional stress: Doctors have found a link between increased stress and geographic tongue.

What are the symptoms of geographic tongue?

While many people don’t notice any symptoms at all, the most recognizable sign of geographic tongue is the appearance of the pattern on the tongue. Symptoms can come and go, and may last a few weeks or years. They include:

  • Red spots on the tongue: The red patches on the tongue appear in an irregular map-like pattern and are often surrounded by white or gray borders. They appear anywhere on the top, sides and tip of the tongue. The patches may come and go, and can change size, shape and location over time.
  • Absence of papillae: The insides of the red patches are noticeably smoother because they do not have any papillae. Papillae are tiny bumps that coat and protect the entire tongue and help us chew food. Some papillae also have taste buds.
  • Burning sensation: Some people with geographic tongue feel a stinging, tingling or burning sensation on their tongue, especially when eating. Discomfort is usually mild and can come and go along with the red patches.
  • Patches in other areas of the mouth: Occasionally, similar red patches can form on the gums, the top of the mouth or inside the cheeks. These patches are called geographic stomatitis or erythema migrans. The patches are not the same as the erythema migrans rash that appears in the early stages of Lyme disease. Having these patches in your mouth does not mean that you have Lyme disease.

How is geographic tongue diagnosed?

Doctors diagnose geographic tongue with a physical exam. Your doctor will ask about your symptoms, including any discomfort while eating or drinking.

How do I know if I have geographic tongue?

If you have tongue pain and smooth, red spots on your tongue in a map-like pattern, you could have geographic tongue. While geographic tongue is harmless, you should see your doctor to rule out other medical conditions.

What are the treatments for geographic tongue?

Because geographic tongue is a benign condition, treatment is not necessary. If you feel pain or discomfort, you should avoid eating anything that can irritate your tongue, such as spicy food. To relieve the stinging or burning sensation, your doctor may recommend:

What are the side effects of the treatment for geographic tongue?

Side effects from NSAIDs are rare, but they can occur. They usually only appear after someone has taken a medication for a long time. Side effects of NSAIDs can include:

What are the complications associated with geographic tongue?

Geographic tongue is a harmless condition with no long-term health complications.

What can I do to help relieve symptoms of geographic tongue?

To relieve the stinging and burning sensation, you should avoid eating or drinking anything that can irritate your tongue, such as hot or spicy food. You should also avoid chewing tobacco since it can make the pain and stinging worse.

What is the outlook for patients who have geographic tongue?

Geographic tongue is harmless. Most people who have geographic tongue have mild symptoms or no symptoms at all. A small group of people have recurring pain and discomfort on their tongue. They manage it with pain relievers and by avoiding foods that trigger the pain.

When should I call my doctor about geographic tongue?

If you have symptoms of geographic tongue, you should visit your doctor to rule out other medical conditions. A red, swollen, or sore tongue could be a sign of another medical problem, so it’s important to see your doctor.

Source:

https://my.clevelandclinic.org/health/diseases/21177-geographic-tongue.

Automatic Tongue Image Segmentation For Real-Time Remote Diagnosis

Abstract—Tongue diagnosis, one of the essential diagnostic methods of Traditional Chinese Medicine (TCM), is considered an ideal candidate for remote diagnosis methods because of its convenience and noninvasiveness. However, the trade-off between accuracy and efficiency and the variation of tongue images pose great challenges in real-time tongue image segmentation. To remedy these problems, in this paper, a light weight architecture based on the encoder-decoder structure is proposed. The tongue image feature extraction (TIFE) module is designed to generate features with larger receptive fields without sacrificing spatial resolution. The context module is used to increase the performance by aggregating multi-scale contextual information. The decoder is designed as a simple yet efficient feature upsampling module to fuse different depth features and refine the segmentation results along tongue boundaries. The loss module is proposed to deal with misclassifications causing by class imbalance. A new tongue image dataset (FDU/SHUTCM) is constructed for model training and testing, which contains ٥,٦٠٠ tongue images and their corresponding high quality masks. We demonstrate the effectiveness of the proposed model on BioHit, PolyU/HIT, and our datasets, achieving the performance of 99.15%, 95.69%,and 99.03% IoU accuracy, respectively. Segmentation of 513×513 image takes 165 ms on CPU.

Index Terms- Tongue diagnosis; Remote Diagnosis; Real-time Segmentation; Light Weight Networks; Encoder-decoder; Dilated Convolutions; Multi-scale Context Aggregation; Class Imbalance.

I.  INTRODUCTION

Tongue diagnosis is one of the essential diagnostic methods of TCM. Remote diagnosis can help to achieve convenient and inexpensive medical services for people. Tongue image segmentation is a binary labeling problem aiming to separate the foreground object (tongue) from the background (non-tongue) region of a tongue image. Real-time tongue image segmentation is an indispensable step in developing remote tongue diagnosis system. Most of the prior work in this area usually assume that the tongue images are taken by TCM doctors in a well-controlled environment, and nearly ten imaging systems have been developed which possess various imaging characteristics [1]. In practice, most of the tongue images are taken by people who have not received professional guidance in a random environment. According to distinct scenarios, the existing tongue image segmentation methods can roughly be divided into two categories:

Methods for Remote Tongue Diagnosis (RTD). In capturedtongue images, the non-tongue parts usually occupy much more space. Furthermore, adverse factors, such as inconsistent exposure, background clutter, seriously affect the precision of the segmentation algorithm. Lin et al. [2] propose an end-to-end tongue image segmentation method based on ResNet. Li et al. [3] propose an end-to-end iterative tongue image matting network by decomposing the process into multiple steps, and achieved a state-of-art performance of 97.92% IoU accuracy.

Methods for Traditional Computer-aided Tongue Diagnosis (CTD). These methods [4] [5] were designed for processinghigh-quality tongue images captured by professional imaging devices under certain conditions (in a dark chest, not in open-air). However, these methods barely work when dealing with various tongue images taken in a random environment.

Generally speaking, the accuracy of the segmentation method can directly affect the tongue diagnosis result. How-ever, factors like memory and computational load during training and testing are crucial to be considered when choosing a real-time method. To sum up, it is rather difficult to implement due to three special factors:

Trade-off between accuracy and efficiency. Real-time remoteapplications aim at obtaining best accuracy under a limited computational budget, given by target platform (e.g., mobile devices with very limited computing power). Both accuracy and efficiency are important, as far as real-time tongue image segmentation methods are concerned.

The complexity of the pathological tongue. As a non-rigidorgan, the tongue has a high degree of variability in texture, color, shape, and size. There are abundant pathological details on the surface of the tongue, such as tongue crack, red point, tooth prints, etc. These details are often with only several-pixel size. (see Fig.4)

The variation of tongue images. In addition to the tongue,obtained tongue images contain many other non-tongue com-ponents, such as lips, teeth, inner tissue of the mouth, and part of the upper body. In most of the captured tongue images, the non-tongue parts occupy much more space than the tongue, which will possibly interfere with segmentation accuracy and robustness. More seriously, the quality of the obtained tongue images considerably varies, adverse factors, such as motion blur, inconsistent exposure, different illumination, and background clutter, seriously affect the precision of the segmentation algorithm (see Fig.5).

So far, there is no single solution that can address all the problems mentioned above. In this paper, we focus on building a practically fast tongue image segmentation method with decent accuracy. The main contributions of our approach are:

  1. An efficient real-time architecture is proposed for pixelwise tongue image segmentation (see Fig.1).
  2. Our model is fast and small. The model size is 9.7 MB. Segmentation of a 513×513 image takes 165 ms on CPU.
  3. Our model attains a new state-of-art performance on BioHit, PolyU/HIT, and FDU/SHUTCM datasets. We also provide detailed analysis of design choices and model variants.
  4. We build a remote tongue image segmentation dataset (FDU/SHUTCM) and benchmark for training and testing. To the best of our knowledge, FDU/SHUTCM is the first dataset that evaluates the real-time remote tongue image segmentation performances. We will publicize this dataset, and hope it will attract more researchers to this topic. https://github.com/FDUXilly/FDU-TCMSU

                 II. RELATED WORK

  1. Image Semantic Segmentation

Deep learning has presented success in the field of computer vision, such as object detection and semantic segmentation. It is essential to know that semantic segmentation tackled by deep learning architectures is a natural step to achieve fine-grained inference, and its goal: make dense predictions

inferring labels for every pixel [6]. Currently, the Fully Convolutional Network [7] is the common forerunner of most state-of-the-art semantic segmentation techniques. Despite the accurateness and flexibility of the FCN model, there are still some limitations:

  1. The context information has been ignored.
  2. It is still far from real-time execution at high resolutions.

Real-time Segmentation: Real-time semantic segmentation methods require a fast way to generate the pixel-wise prediction under limited calculation in mobile applications. ENet [8] considers reducing the number of down sampling times and delivers high speed. ESPNet [9] performs a new spatial pyramid module to achieve real-time prediction. Differently, in this paper, our method employs a lightweight model to provide sufficient receptive field and capture adequate context information.

Multi-scale Context Aggregation: A possible way to deal with context information integration is the use of multi-scale context aggregation. PSPNet [10] and DeepLab series [12] [13] [14] combine more context information and multi-scale feature representation to obtain high-quality segmentation results.

Encoder-decoder Networks: The encoder-decoder networks have been successfully applied to many computer vision tasks. Typically, the encoder module gradually reduces the feature maps and captures higher semantic information; the decoder module gradually recovers the reduced spatial information and obtains sharp object boundaries. Unet [16] uses the skip connection. SegNet [15] utilizes the saved max

pool indices to recover spatial information.

  • Light Weight Backbone Networks

Recently, many advanced applications are demand processing of data locally on various edge devices. And there has been rising interest in building efficient networks by making excellent internal structural improvements to existing networks. SqueezeNet [17] proposes a new convolution method, called the fire module, which reduces the dimension of the feature map. MobileNetV1 [18] is based on a streamlined architecture that use depthwise convolution and pointwise convolution layers to build light-weight neural networks. ShuffleNets [20] propose the pointwise group convolution using channel shuffle, improving the computational efficiency, and reducing the number of parameters. MobileNetV2 [19] introduces inverted residuals and linear bottlenecks to achieve near state-of-the-art segmentation performance.

                  III. METHOD

  1. Encoder Module

Dilated convolution for dense feature extraction and field-of-view enlargement. Dilated convolution, a powerful tool which supports the exponential expansion of the receptive field without loss of resolution.

Dilated separable convolution for computational efficiency. Depthwise separable convolution, as illustrated in Fig.2(a)(b), factorizing a standard convolution into a depthwise convolution followed by a pointwise. Dilated separable convolution [14], factorizing a standard convolution into a pointwise convolution and a dilated depthwise convolution (see Fig.2(c)), reduces the computation complexity of the model while getting better performance.

The Tongue Image Feature Extraction (TIFE) module. We propose the cascaded convolutional blocks used as tongue feature extractors (see Fig.3). We use PReLU [23] as the non-linearity, which is slightly better for image segmentation than using ReLU (see TABLE III). Group Normalization [21] is utilized during training. All layers (pointwise convolution and dilated depthwise convolution) are followed by a Group

normalization and a PReLU non-linearity except for the last point-wise convolution.

The context module: dilated spatial pyramid pooling for multi-scale context aggregation. The context module is designed to increase the performance of dense prediction architectures by aggregating multi-scale contextual information. In our work, objects (tongue) usually have very different sizes (see Fig.4, Fig.5). To handle this case, feature maps must be able to cover different scales of receptive fields, so parallel of several dilated convolutional layers with different dilated rates have been used, formally termed as ASPP [13]. ASPP consists of: one 1×1 convolution and three 3 ×3 dilated convolutions, and one global average pooling.

  • Decoder Module

The role of the decoder module is to upsample the output of the encoder and fine-tune the details. In our work, the decoder is designed as an efficient feature upsampling module to fuse low-level feature maps from Block(1,3,4,6). We propose to fuse low-level features (extracted from previous layers) and

high-level features (extracted from subsequent layers) directly. The encoder features are first upsampled and then concatenated with low-level features from the cascaded convolutional blocks (see Fig.1). We apply 1×1 convolution on the fused low-level features to reduce the number of channels. Our simple yet effective decoder module refines the segmentation results (see TABLE III).

  • Loss Module

In most of the remote tongue images, the number of fore-ground pixels is much smaller than the number of background pixels, resulting in the severe imbalance between positive samples and negative samples. Following focal loss [22] indset, we employ a hard-sample-aware loss (see (1)), where each pixel i of a given image has to be classified into a class c ∈ C {tongue, non-tongue}, p is the number of pixels in the image or minibatch considered, yi∗ ∈ C is the ground truth class of pixel i, (1−yi∗)γ is a modulating factor, αi is a balanced factor, fi(yi∗ ) is the probability of pixel i belong to the correct class, and f is the vector of all network outputs fi(c). And this always comes from mapping the unnormalized scores Fi(c)

through a softmax unit (see (2)).

During testing, the decision function commonly used consists in picking the class of maximum score: the predicted class for a given pixel i is  yi = argmax Fi(c)  c ∈ C. We observe that our proposed loss module works consistently better by handling imbalanced classes (see TABLE III).

                   IV. EXPERIMENTS

  1.  Data Preparation

So far, there are few public standard tongue image datasets [24] [25] (see TABLE I). And images in both datasets are taken by TCM doctors in a well-controlled environment. To fill the gap, we construct a novel dataset named FDU/SHUTCM as a benchmark for real-time remote tongue image segmentation.

Data amount. We have collected 5600 tongue images in JPG image format. These images are split into the training and testing sets with 4,600 and 1,000 images, respectively. We manually labeled them with Photoshop quick selection.

Image diversity. Images in our dataset are with large structure variation for both foreground and background regions (see TABLE II, where α = area(tongue body) /area(tongue image) ). As a nonrigid organ, the tongue has a high degree of variability in size, shape, color, and texture (see Fig.4).

Data augmentation. In order to enhance the performance of the model, we exploit different rotation, reflection and resizing to increase the number of training images. Four rotation angles {-45,-20,20,45}, four scales {0.5,0.8,1.2,1.5} and four Gamma values {0.5,0.8,1.2,1.5} are used.

B. Performance Evaluation Metrics

Real-time semantic segmentation methods require a fast way to generate the pixel-wise prediction under limited calculation in mobile applications. Many aspects must be evaluated to assert the validity and usefulness of the method: accuracy, latency, and computational cost. The accuracy is measured by Pixel Accuracy (PA) and Interaction-over-Union (IoU) :

C. Experiment Results

We conduct the experiments on a computer with 56 CoreTM E5-2660 2.00GHz processor, 128GB of RAM, and four TITAN XP Graphics Card.

Inference strategies. We denote output stride as the ratio of input image resolution to the encoder output resolution. OS: The output stride used during training. COCO: Models pretrained on MS-COCO [28]. DA: Data augmentation. CM: Employing the proposed context module. DM: Employing the proposed decoder module. LM: Employing the proposed loss module.

In this work, we found that the TIFE module significantly reduces the computation complexity of the model while maintaining better performance (compared with [18], [19], [17], [20] ). As shown in TABLE III, employing outputstride=8 brings 0.56% improvement over using outputstride=16; adding CM, DM, GN, PReLU and LM further improve the performance by 2.57%, 1.73%, 0.59%, 0.62% and 1.21%, respectively. What’s more, concating the low-level feature maps from Block (1,3,4,6) leads to better performance. We pretrain our proposed model on MS-COCO dataset, which yields about extra 0.5% improvement. Adopting data augmentation as post processing brings another 0.48% improvement.

Performance on BioHit and PolyU/HIT. BioHit [24] is a public tongue image dataset which composes 300 tongues

images in BMP format. These images all have a resolution of 768 × 576. We randomly selected 100 images in BioHit

for testing. The PolyU/HIT [25] (without annotations) tongue image dataset contains 12 color images in BMP format. And the resolution of the tongue images is different.

Our model is pretrained on MS-COCO and FDU/SHUTCM datasets. We evaluate the performance of our methods with representative methods, and the results show that our method can achieve 99.15% and 95.69% IoU accuracy on BioHit and PolyU/HIT dataset, better than other methods (see TABLE IV). The visual segmentation results of our method on BioHit and PolyU/HIT datasets can be seen in Fig.6 and Fig.7.

Performance on FDU/SHUTCM. We perform a thorough comparison between our model and existing state-of-the-art methods basing on labeled 1,000 testing images. TABLE IV shows the experimental results on FDU/SHUTCM testing data, which include approaches using hand-crafted features [4], [26], deep CNN features [7], [11], [16] , [12], [27], [13], [15], [14], [8], [9], [3], [2]. As can be observed, the accuracy of our

model significantly outperforms state-of-the-art methods [14] [13], while the inference speed and the computational cost are kept comparable with real-time methods [15] [8] [9]. Given the computation complexity budget of only 4.4 GFLOPs, Our method can achieve 99.03% IoU accuracy on FDU/SHUTCM

dataset, better than other methods. The model size is 9.7 MB. Segmentation of a 513×513 tongue image takes 165 ms on CPU. Furthermore, our model is robust to challenging inputs, and the visual segmentation results can be seen in Fig.8.

V. CONCLUSION

In this paper, we have proposed a novel real-time tongue image segmentation method. Our architecture is fast, small, yet still preserves segmentation accuracy. And it is robust and adaptive to many adverse factors, such as motion blur, inconsistent exposure, different illumination, and background clutter. A new tongue image dataset (FDU/SHUTCM) containing thousands of images and their corresponding high-quality mask is launched, contributing to the development of machine learning in tongue diagnosis. Finally, our experimental results show that the proposed model sets a new state-of-the-art performance

on BioHit, PolyU/HIT, and FDU/SHUTCM datasets.

ACKNOWLEDGEMENT

This work was supported by the National Natural Science Foundation of China (No. 81373555, No. 81774205), Special Fund of the Ministry of Education of China (No. 2018A11005) and Jihua Lab under Grant No.Y80311W180.

REFERENCES

[1] D. Zhang, H. Zhang, and B. Zhang. Tongue Image Analysis. Springer, 2017.

[2] Bingqian Lin, Junwei Xle, Cuihua Li, and Yanyun Qu. Deeptongue: Tongue segmentation via resnet. pages 1035–1039, 2018.

[3] Xinlei Li, Tong Yang, Yangyang Hu, Menglong Xu, Wenqiang Zhang, and Fufeng Li. Automatic tongue image matting for remote medical diagnosis. pages 561–564, 11 2017.

[4] Jingwei Guo, Yikang Yang, Qingwei Wu, Jionglong Su, and Ma Fei. Adaptive active contour model based automatic tongue image segmentation. In International Congress on Image & Signal Processing, 2017.

[5] Kebin Wu and David Zhang. Robust tongue segmentation by fusing region-based and edge-based approaches. Expert Systems With Applications, 42(21):8027–8038, 2015.

[6] Alberto Garciagarcia, Sergio Ortsescolano, Sergiu Oprea, Victor Villenamartinez, and Jose Garcia Rodriguez. A review on deep learning techniques applied to semantic segmentation. arXiv: Computer Vision and Pattern Recognition, 2017.

[7] Jonathan Long, Evan Shelhamer, and Trevor Darrell. Fully convolutional networks for semantic segmentation. computer vision and pattern recognition, pages 3431–3440, 2015.

[8] Adam Paszke, Abhishek Chaurasia, Sangpil Kim, and Eugenio Culurciello. Enet: A deep neural network architecture for real-time semantic segmentation. arXiv: Computer Vision and Pattern Recognition, 2017.

[9] Sachin Mehta, Mohammad Rastegari, Anat Caspi, Linda G Shapiro, and Hannaneh Hajishirzi. Espnet: Efficient spatial pyramid of dilated convolutions for semantic segmentation. european conference on computer vision, pages 561–580, 2018.

[10] Hengshuang Zhao, Jianping Shi, Xiaojuan Qi, Xiaogang Wang, and Jiaya Jia. Pyramid scene parsing network. computer vision and pattern recognition, pages 6230–6239, 2017.

[11] Liang Chieh Chen, George Papandreou, Iasonas Kokkinos, Kevin Murphy, and Alan L. Yuille. Semantic image segmentation with deep convolutional nets and fully connected crfs. Computer Science, (4):357–

361, 2014.

[12] Liang-Chieh Chen, George Papandreou, Iasonas Kokkinos, Kevin Murphy, and Alan L. Yuille. Deeplab: Semantic image segmentation with deep convolutional nets, atrous convolution, and fully connected crfs.

CoRR, abs/1606.00915, 2016.

[13] Liangchieh Chen, George Papandreou, Florian Schroff, and Hartwig Adam. Rethinking atrous convolution for semantic image segmentation. arXiv: Computer Vision and Pattern Recognition, 2017.

[14] Liangchieh Chen, Yukun Zhu, George Papandreou, Florian Schroff, and Hartwig Adam. Encoder-decoder with atrous separable convolution for semantic image segmentation. european conference on computer vision, pages 833–851, 2018.

[15] Vijay Badrinarayanan, Alex Kendall, and Roberto Cipolla. Segnet: A deep convolutional encoder-decoder architecture for image segmentation. IEEE Transactions on Pattern Analysis and Machine Intelligence, 39(12):2481–2495, 2017.

[16] Olaf Ronneberger, Philipp Fischer, and Thomas Brox. U-net: Convolutional networks for biomedical image segmentation. In International Conference on Medical Image Computing & Computer-assisted Intervention, 2015.

[17] Forrest N Iandola, Song Han, Matthew W Moskewicz, Khalid Ashraf, William J Dally, and Kurt Keutzer. Squeezenet: Alexnet-level accuracy with 50x fewer parameters and ¡0.5mb model size. arXiv: Computer

Vision and Pattern Recognition, 2017.

[18] Andrew G Howard, Menglong Zhu, Bo Chen, Dmitry Kalenichenko, Weijun Wang, Tobias Weyand, Marco Andreetto, and Hartwig Adam. Mobilenets: Efficient convolutional neural networks for mobile vision applications. arXiv: Computer Vision and Pattern Recognition, 2017.

[19] Mark B Sandler, Andrew G Howard, Menglong Zhu, Andrey Zhmoginov, and Liangchieh Chen. Mobilenetv2: Inverted residuals and linear bottlenecks. computer vision and pattern recognition, pages 4510–4520, 2018.

[20] Xiangyu Zhang, Xinyu Zhou, Mengxiao Lin, and Jian Sun. Shufflenet: An extremely efficient convolutional neural network for mobile devices. computer vision and pattern recognition, pages 6848–6856, 2018.

[21] Yuxin Wu and Kaiming He. Group normalization. arXiv: Computer Vision and Pattern Recognition, 2018.

[22] Tsungyi Lin, Priya Goyal, Ross B Girshick, Kaiming He, and Piotr Dollar. Focal loss for dense object detection. international conference on computer vision, pages 2999–3007, 2017.

[23] Kaiming He, Xiangyu Zhang, Shaoqing Ren, and Jian Sun. Delving deep into rectifiers: Surpassing human-level performance on imagenet classification. international conference on computer vision, pages 1026– 1034, 2015.

[24] BioHit. ”TongueImageDataset”. http://github.com/BioHit /TongueImageDataset, 2014.

[25] PolyU/HIT Tongue Database. http://www.comp.polyu.edu.hk / biometrics/.

[26] Carsten Rother. Grabcut: interactive foreground extraction using iterated graph cuts. In Acm Siggraph, 2004.

[27] Pedro O. Pinheiro, Ronan Collobert, and Piotr Dollar. Learning to segment object candidates. 2015.

[28] Tsungyi Lin, Michael Maire, Serge J Belongie, James Hays, Pietro Perona, Deva Ramanan, Piotr Dollar, and C Lawrence Zitnick. Microsoft coco: Common objects in context. european conference on computer

vision, pages 740–755, 2014.


Advances in automated tongue diagnosis techniques

© 2018Korea Institute of Oriental Medicine.Publishing services by Elsevier B.V.This is an open access article under the CCBY-NC-ND license (http://creativecommons.org/licenses/by-nc-nd/4.0/)

Abstract

Tongue diagnosis can be an effective, noninvasive method to perform an auxiliary diagnosis any time anywhere, which can support the global need in the primary healthcare system. This work reviews the recent advances in tongue diagnosis, which is a significant constituent of traditional oriental medicinal technology, and explores the literature to evaluate the works done on the various aspects of computer- ized tongue diagnosis, namely preprocessing, tongue detection, segmentation, feature extraction, tongue analysis, especially in traditional Chinese medicine (TCM). In spite of huge volume of work done on auto- matic tongue diagnosis (ATD), there is a lack of adequate survey, especially to combine it with the current diagnosis trends. This paper studies the merits, capabilities, and associated research gaps in current works on ATD systems. After exploring the algorithms used in tongue diagnosis, the current trend and global requirements in health domain motivates us to propose a conceptual framework for the automated tongue diagnostic system on mobile enabled platform. This framework will be able to connect tongue diagnosis with the future point-of-care health system.

Keywords: Automated tongue diagnosis, Image processing, Machine learning, Mobile-enabled systems, Clinical decision support systems.

1. Introduction

The global demand for primary healthcare support and the advancement of technology enable the platforms for point-of-care (POC) diagnostics.1 Despite the recent advances in automated disease diagnosis tools, the requirement of blood serum via nonprofessionals, accuracy, reliability, detection time, and requirement of second confirmatory test are the challenges yet to overcome.2 Thus, temperature, tongue diagnosis, retinopathy, facial expressions, skin color, and surface could be few vital parameters for future smartphone-based clinical expert systems to attain simplicity, immediacy, noninvasiveness, and automatic analysis.

Tongue diagnosis is an effective noninvasive technique to evaluate the condition of a patient’s internal organ in oriental medicine, for example, traditional Chinese medicine (TCM), Japanese traditional herbal medicine, traditional Korean medicine (TKM).345 The diagnosis process relies on expert’s opinion based on visual inspection comprising color, substance, coating, form, and motion of the tongue.56 Instead of tongue’s abnormal appearance and disease, traditional tongue diagnosis is more inclined to recognize the syndrome.789 For an example, the tongue coating white-greasy and yellow-dense appearance signifies cold syndrome and hot syndrome, respectively, which are tied with health conditions such as infection, inflammation, stress, immune, or endocrine disorders.10 These are two parallel, yet correlated syndromes in TCM. Eliminating the dependency on subjective and experience-based assessment of tongue diagnosis may greatly increase the scope for wider use of tongue diagnosis in the world including Western medicine. Computerized tongue inspection implicating light estimation, color correction, tongue segmentation, image analysis, geometry analysis, etc. could be an effective tool for disease diagnosis aiming to address these concerns.

Tongue diagnosis is not a widespread perception in western medical practice, which leads to one of the key challenges, that is, availability of the authentic classified dataset. On the other hand, Cheng et al11 questioned about the reliability and validity of practitioners of western medical system using TCM. They emphasized on the importance of the degree of agreement and criticized the adaptation of ‘proportion of agreement’. Belonging to oriental medicine, significant amount of work on tongue diagnosis is published in Chinese. To the authors’ best knowledge, the only detailed survey conducted up to 2012 was motivated by hardware and software of tongue diagnosis.5 There are recent advancement of mobile phone sensors, dynamics of its application, machine learning techniques, and expert systems,12131415161718 which has the potential to be implemented for automatic tongue diagnosis (ATD). Thus, there is a need to cover the insufficiency of focus on algorithms, machine learning techniques, and clinical decision support system (CDSS) related to tongue diagnosis. This work aims to investigate the scope of combining tongue diagnosis with the current research practice, making it work as an expert system without human intervention. The merits and capabilities of existing systems are explored to identify the research gap to achieve this goal. This work will provide an insight into the achievements so far and the mechanism to achieve the ultimate goal of automated tongue diagnosis.

Though few techniques used in case of tongue diagnosis find its applicability in different fields such as speech mechanism,19 tongue-operated system for Tetraplegia patients, this paper does not focus on such cases. This work considers the work published in English only. Manual, intended for digital diagnosis, semiautomatic, and ATD are considered to be reviewed. This work explores the state-of-the-art works done on tongue diagnosis and presents a direction toward a standard and complete work so that tongue diagnosis can be included as an auxiliary diagnosis to support the primary healthcare system. In Section 2, tongue diagnosis systems in general, especially hardware components associated with them are overviewed. In Section 3, tongue image segmentation and feature extraction techniques are critically reviewed. The inconsequential works done on specific disease detections are explored in later section (Section 4) followed by limited work done on mobile-enabled platform for tongue diagnosis (Section 5). The main focus of the work is algorithms used in different steps of ATD. On the basis of the research gap in the existing works, an overall conceptual diagram is presented in the last section (Section 6) to address the concerns undertaking the trend of the demand.

2. Tongue diagnosis systems

Because of advancement in image sensing modules, various image acquisition and analysis devices for tongue inspection commonly known as tongue diagnosis systems (TDSs) are surveyed and shaped. Jung et al5 reviewed both type of TDSs:

i) hardware consisting image sensing module, illumination module, compute, and

ii) control module and software for color correction, tongue image segmentation, and tongue classification in literature up to 2012.

To obtain quantitative and objective diagnostic results, the TDS needs to deliver reproducible tongue images under varying environmental conditions. In addition to commercially available digital cameras, many works used charge-coupled devices (CCD) with different configuration as the image sensing module.46202122232425262728 In recent literatures, both Cibin et al24 and Zhang and Zhang23 used 8-bit resolution 3-chip CCD cameras. The use of tongue image capturing device2223 is similar to the use of conventional digital camera. Kim et al,29 Zhang et al,21 and Jiang et al30 used CCD cameras to outline tongues, whereas Zhang et al22 placed D65 fluorescent tubes around the 8-bit resolution CCD camera to maintain uniform illumination. Different imaging schemes are described in Section 2.1. The work performed on color correction and light source estimation is explored in Section 2.2.

2.1. Different computerized tongue image analysis systems1

Specialized tongue capturing devices1 (e.g., tongue diagnostic information acquisition system) are often utilized to portray features such as tongue color, moisture, greasiness, indentation, pricking, fissure in tongue diagnostic information acquisition systems.381031 The CCD camera is light-sensitive, but it has the ability to produce quality images with less visual noise and distortion. When it comes to mobile phone camera, complementary metal-oxide-semiconductor (CMOS) is replaced by CCD due to power consumption and data-throughput speed. In order to improve the performance and gather more information, Zhi et al,32 Li and Liu,33 Yamamoto et al,6 and Li34 utilized hyperspectral imaging for tongue diagnosis. With an aim to attain the spectrum of an individual pixel in the image of a scene, the hyperspectral imaging is performed to find objects, identify materials, and detect processes. Though RGB is the most influential color model for tongue image analysis, to facilitate better distinguish between tongue coating and tongue body as well as differentiating among closely alike tongue and neighboring tissue colors, Zhi et al32 took the stance in favor of hyperspectral imaging. Unlike the traditional 2D imaging system with visible light waves, it can collect data from multiple bands. Zhi et al32 performed hyperspectral comparison of combinations of tissue types on 300 chronic Cholecystitis patients and 75 healthy subjects. Hyperspectral tongue images were analyzed through different classifiers. The performance of this approach was evaluated in contrast with the traditional RGB model as well. The authors stated their suggested method to be more successful than conventional RGB approach to a certain extent. Yamamoto et al6 used a hyperspectral camera to quantify color spectrum of both coated and uncoated tongue, lips, and periodical areas by considering highlight, shadow, and tongue coating.

Li34 captured hyperspectral tongue images at a series of wavelength to segment the tongue image, illustrated tongue colors and analyzed the tongue texture. A new algorithm was proposed using a Gabor filter for the tongue texture analysis. The Gabor filter is a linear filter, similar to human visual system. The two-dimensional Gabor filter is a Gaussian kernel function, which is modulated by a sinusoidal plane wave, useful for edge detection. The experimental result in Li34 showed promising for the postprocessing of computerized tongue diagnosis. Another example of a hyperspectral tongue imaging system is the work of Li et al,35 which presented a sublingual vein extraction algorithm using a hidden Morkov model. The sublingual vein is responsible for draining the tongue. These veins may be linked with number of diseases. Thus, the work involved outlining the spectral correlation and the multiband variability to accumulate more information about the tongue surface. Pixel-based sublingual vein segmentation (PBSVS) algorithm and spectral angle mapper (SAM) algorithm were used and the performance of their algorithms was analyzed based on 150 scenes of hyperspectral tongue images. Even in the presence of noise, the result was found to be more satisfactory than conventional algorithms. Li and Liu33 developed a pushbroom hyperspectral tongue imager to capture tongue images. They used SAM on 200 hyperspectral images to analyze tongue color based on the spectral response. The trajectory of tongue surface color distribution was tracked by the presented algorithm. For each color category, the correctness rate of color recognition was 85% and 88% for tongue substance and tongue coating, respectively. However, none of these works exercised disease classification exploiting the extracted features obtained from hyperspectral tongue images.

In order to attain three-dimensional geometry of a tongue, the 3D tongue diagnostic system could be an effective tool. Though 3D tongue imaging is more popular for visual speech synthesis,36 pronunciation recovery of impaired hearing individuals’, limited work373839 has been done in the field of tongue diagnosis. TCM holds the view that the shape of the tongue can change and it indicates particular pathologies.40 In TCM, the shapes of tongues are classified into seven types: ellipse, square, rectangular, round, acute triangular, obtuse tri-angular, and hammer. The ellipse tongue represents the normal tongue.

An alternative view of tongue diagnosis is thus 3D imaging. The thickness measurement, impulsively changing the curvature of the tongue surface angle could be better represented with the 3D tongue modeling scheme. This is supported by Liu et al,39 who described a framework to reconstruct bending human tongue on the basis of multiview geometry. They used two light sources and a frame to fix the face-location. With the help of four cameras, they adjusted the exposure time and high speed frame rate. To locate the tongue, a laser device was utilized. The artificial features were created on a tongue surface through an adjustable laser beam. Finally, a finite-element-based representation of the tongue was attained.

Many of these devices, utilized by the existing systems, are capable of compensating lighting environmental condition (discussed in Section 2.2), but none of these systems is standalone (i.e., the system cannot provide the diagnosis or syndrome itself). Most systems are portable but they lack a collective intelligence to provide the final diagnosis.

2.2. Light source estimation and color correction

Lighting condition is considered to be an important prerequisite for tongue diagnosis. Different approaches have been taken to solve the challenging problem of lighting condition estimation. These solutions include controlled environment,2729 color correction,41 hardware based implementation, for example, tongue image acquisition device20 and ColorChecker.42 An image taken with the same camera may provide different tongue diagnosis due to the variation in the color properties at different lighting conditions. The imperfection in camera operation may cause some consequences.28 The inconsistence imaging with different devices may affect as an added disadvantage making it inconvenient to share or interchange.

Jang et al26 and Zhang et al20 used halogen tungsten lamp as the light source to capture tongue images. Both of them used low color temperatures. The color temperature of a lamp is the temperature of an ideal black-body radiator that radiates light of comparable hue to that of the lamp. It is a way to describe the light appearance provided by a light source, measured in degrees of Kelvin (K) on a scale from 1000 to 10,000. Typically, the light appearance of 2000–3000 K is referred to warm white, producing orange to yellow-white light; 3100–4500 K is cool or bright white emitting more neutral white light with probable blue tint and 4600–6500 K and above tries to imitate the daylight, producing a blue-white light and creating a crisp and invigorating ambience. However, the use of inadequate color temperature in the mentioned work failed to render color in high fidelity. Because of work done with reddish-biased images produced under halogen tungsten lamp, this is no longer a conventional method.

Research on tongue diagnosis includes placement of fluorescent lamp,25 standard light source installed in a dark chest,43 Köhler illumination,44 built-in LED lighting for tongue diagnosis. In general, Köhler illumination is used in optical microscopy as a specimen illumination method for transmitted and reflected light. It is useful to generate an incredibly even illumination of the sample. It has the ability to repress illumination source in the resulting image. However, the requirement of additional optical elements makes it more expensive. Another passing fad is taking images in public office environment.26 Hu et al41 analyzed tongue features observed under different lighting conditions such as fluorescent, incandescent, and halogen illuminant. They used Support Vector Machine (SVM) to make the system independent of lighting environment. To nullify inconsistent or varying lighting conditions, another current trend is hyperspectral imaging.3335 Another SVM-based work is recently reported to attain 94% accuracy to classify four tongue-related colors, that is, red, light red, and deep red.46 This work encompassed classification in two stages. The first stage involved the unsupervised machine learning, k-means. The background separation was partly involved at this stage. The later stage was based on SVM. The execution time was only 48 seconds, which shows the potential to be implemented as a real time tongue image segmentation technique. Because of the 2-layer segmentation process, SVM improved the color detection, that is, classification by 41.2%.

Even after using low color temperature halogen lamps, some work26 did not involve any color correction method. As a color correction scheme, the printed color card has been used in the earlier work.2025434547 Some4547 used Munsell Color Checker as well. Munsell was considered to be the first color order system to separate hue, value, and chroma into perceptually uniform and independent dimensions and to systematically illustrate the colors in 3D space. Hu et al48 used SVM-based color correction matrix nullifying the dependency on controlled lighting environments and tongue positions. The lighting environment included with and without flashlights. They further improved their work and acquired better result.41 To the best of authors’ knowledge, this is the best work done so far in the field of tongue diagnosis for light estimation and color correction. Another popular convention is transforming the image into standard color space which could be achieved by both hardware and software manipulation.

On the other hand, recent advances of mobile phones are endeavoring to address lighting condition and color correction issue on its own. The camera lens, resolution, aperture, stabilizer, filter, multiframe imaging, and strong image processing software are able to manage the ambient condition better than ever. The back camera-front camera issue41 is also resolved for many phone brands. However, as chromatic features of tongue images hold the disease information, light estimation can still play a crucial role.

3. Image segmentation and feature extraction

The most challenging part of tongue diagnosis is an adequate segmentation and optimum feature extraction. Before starting the image segmentation, few works in literature preferred tongue detection and positioning. At the next stage, both color and geometric features need to be carefully extracted to feed into the subsequent steps.

3.1. Tongue detection and positioning

Zhong et al49 used mouth location method to locate dark hole’s position in the mouth and active appearance model (AAM) for automatic tongue segmentation. The method required a different initial contour for tongue body segmentation which made it technically infeasible.

In order to fix the tongue position, a guidance scheme for image acquisition system which outline the frontal and feedback gridlines, was sketched by Jung et al.4 The study included three categories, namely, nil, frontal, and frontal and profile gridline and 120 images were assessed based on profile angle and tongue area ratio. Jung et al4 discussed the relationship between diagnosis accuracy and repeatability of tongue features, for example, color and shape. The intraclass correlation coefficient was computed to examine repeatability. The result suggested an improvement in color and shape repeatability. Their study involved only healthy tongues which could be further used as a calibration model for related works.

3.2. Color models and chromatic features

The tongue diagnosis comprises recognizing the disease-related colors on the tongue surface and analyzing the texture. The tongue image segmentation steps such as edge detection and background–foreground separation are commonly processed in gray scale. However, the overall tongue image analysis needs to be processed in color format. The color gamut of a tongue image in different color spaces are portrayed in Fig. 1 as a point cloud. A summary of digital camera-based works in different color space focusing different features is presented in Table 1.

The RGB (Red, Green, Blue) is the most popular model for tongue diagnosis describing what kind of light needs to be emitted to produce a given color.305062 The RGB space was utilized to extract tongue color features, for example, means and standard deviations of the colors per pixel within the region of interest.30 It is seen as true color in MATLAB, but the model is device dependent, which means there are many variations of RGB color space for the same image using different devices. HSI (Hue, Saturation, Intensity) and HSV (Hue, Saturation, Value or Brightness) are two cylindrical-coordinate representations of points in a RGB model. HSI is closer to human vision. Zhu et al51 favored HSI due to its specificity of the application in tongue image extraction. With the help of HSI color model, the greedy rules were utilized to develop the template. Then, the template was processed. After successful separation of background from the raw image, the template was found to be effective even for thick tongue coating. It can be useful for the quantitative evaluation of tongue.52 The hue and intensity were exploited by Jian-Qiang et al,55 for tongue image segmentation which worked well for regular tongue surfaces, but not for the irregular ones. Li et al56 used hue and brightness of HSV to decide the initial position of the tongue, whereas Jiang et al30 reported that HSV is unsuitable for tongue diagnosis as it has discontinuities in hue value around red, making it sensitive to noise. The color information is separated from the energy or image intensity in HSV, making the color space less noise-prone than in RGB. HSV being popular in the library like OpenCV for Android platform makes it a strong candidate to consider.

In the recently reported article on tongue diagnosis, researchers have found to prefer LAB over the other color space as it is more perceptually linear giving the advantage of effective visual inspection and comparison. L stands for lightness and ‘a’ and ‘b’ are the color opponent dimensions. Analyzing the tongue indices, the mean a* of the whole tongue area was found to be distinguishably different between people with and without Yin-deficiency.58 Thus, the color channel values can provide significant information about the patient’s condition.

Continuing with LAB color space, Jung et al4 explored diagnosis accuracy and considered the intraclass correlation coefficient to inspect tongue feature’s repeatability. The median value of tongue region, that is, tongue body was taken into account for color feature computation.63 Kawanabe et al59 examined tongue color, its body, and coating by analyzing tongue images of 1080 subjects. They cataloged tongue color and tongue coating into five and six categories, respectively in the L*a*b* color space. To compute tongue body and coating information, k-means clustering (an unsupervised machine learning technique) was employed. The authors suggested the outcome as a globally suitable tongue color diagnostic standard. However, the reliability was not quantified, especially for the tongue of unhealthy subjects. From the a* value difference, Kim et al58 separated the tongue coating from the tongue body area. The tongue coating was quantified by tongue coating percentage index. As the image was captured by a CTIS, the generated image needed to be transformed into L*a*b* from RGB.

Although tongue image capturing devices are useful, in literature, more works are done using a CCD camera. Hsu et al54 used a head mounted tongue capture device. Tongue image segmentation based on chromatic information is performed in the literature using all standard color models. However, sRGB (standard Red Green Blue) is found to be more popular choice to fuse color and space information.

Extracting primary core colors by an iterative method, Chen et al57 used Generalized Lloyd Algorithm (GLA) to obtain the color histogram. Because of the inadequacy of chromatic features, textural features were taken into account by an edge histogram descriptor. This ‘content-based image retrieval technology’ produced improved result, considering different weights for two features in retrieval. The work focused on feature extractions only, and disease classification was not considered. Inclusion of disease classification with same dataset of 268 images would have enlightened the readers more about the result obtained from feature extraction.

The artificial neural network (ANN) is not an exceptional choice for chromatic analysis. ANN has been successfully used in medical diagnosis due to its ability to process large volume of data, reduced probability of ignoring relevant information, and faster computational time.64 For example, the output of a wireless capsule endoscopy for evaluating the gastrointestinal tract is an 8 hours long video. To reduce the inconvenience of already over burden health system, Barbosa et al65 utilized an ANN to diagnose and classify small bowel tumors analyzing the visual information of wireless capsule endoscopy. An enhanced HSV color model was utilized for the segmentation purpose, using the convolutional neural network (NN).66 However, Cheung et al67 argued that the neural network is complex and time consuming. Table 2 demonstrates the practice of neural network for color-based analysis. However, Zhuo et al68 discouraged NN for online color correction in the current context due to the requirement of large sample size to train the NN-based mapping model. The polynomial-based correction method was favored for its lower computational complexity.

In the field of medical image processing, gray scale images are more prevalent than color images. The tongue diagnosis comprises recognizing the disease-related colors on the tongue surface and analyzes the texture. Therefore, one needs to address the issue of volume of colors to be managed. The complex part is the resemblance of the involved colors. Most of the disease-reflection features are reported to be located in the 2% region between the 100% and 98% of the full tongue color range.47 Thus, J measure based segmentation (JSEG) algorithm is performed to test the homogeneity of a given color-texture pattern. The method involved unsupervised machine learning techniques such as k-means clustering and a hierarchical clustering (called agglomerative clustering). This segmentation method is computationally more feasible than model parameter estimation. The method proposed by Deng and Manjunath71 is illustrated in Fig. 2. The color quantization starts with the peer group filtering,72 which provides a smooth image by removing the noise. It also provides a smoothness indicator value. The weight to each pixel is assigned in such a way that pixel at textured area’s weight is less than smooth area’s weight. The implementation of agglomerative clustering algorithm increases the pixel of approximate same color, decreasing the global distribution. The color class-map is applied to local window and then J-image is obtained using Fisher’s multiclass linear discrimination.


The implementation of JSEG, proposed by Deng and Manjunath,71 is shown in Fig. 3 to illustrate the effective color reduction keeping the useful information intact.


Although chromatic features are essential to analyze, it is not sufficient enough to provide the complete information. Thus, this work will continue to discuss about different image processing techniques in the next section.

3.3. Edge detection techniques

Edge detectors are essential tools for tongue diagnosis and one of the most popular techniques. The prewitt, sobel, and Laplacian filters are commonly used edge detectors for medical image processing. To separate the tongue from face and mouth (i.e., background–foreground separation), different versions of canny filter73 are used21567475. Shi et al75 used canny to find the tongue tip point. Zhang et al21 used CCD camera to outline tongue via canny algorithm and then utilized feature extraction to diagnose diseases. The authors transformed the image into gray scale and an optimized canny algorithm to obtain the edge image. Kanawong and Xu76 presented a complete automatic tongue detection and tongue segmentation framework method excluding any parameter adjustment and initialization. They proposed a Principal Component Analysis (PCA)-based tongue detection algorithm and hybrid tongue segmentation utilizing mean shift algorithm, canny edge detection algorithm, and Tensor Voting algorithm. However, the use of only one sample makes the system incompetent. The Sobel is another popular filter to be found in the literature.5659 Few works have been done using mathematical morphology. Li et al56 compared different tongue image extraction methods such as geodesic active contour, HSI color model (mathematical morphology and sequential algorithm), and presented a method that involves multiobjective greedy rules to employ fusion of color and space information. Jian-Qiang et al55 utilized morphological opening to eliminate the thin link of lower lip attached with the tongue image and morphological closing to get rid of the small holes on tongue.

3.4. Contour shape

The contour detection is quite prevalent for tongue region segmentation. The snake model finds its usefulness on tongue image segmentation with modifications.5075777879 The dual snake was used for tongue segmentation with 92.89% accuracy.78 Noise removal and HIS color model transformation were conducted before implementing the algorithm to achieve an accurate contour. However, the method was not feasible due to the hurdle to attain the initial contour, both inside and outside. Shi et al79 used snake geodesic active contour (GAC) model for tongue image segmentation. GAC is also known as geometric active contour or conformal active contours. The model is inspired by the Euclidean curve shortening evolution. On the basis of the object of the image, the contour splits and merges. Shi et al79 categorized the images of the database by tongue colors and it contained four classes and ten branches. The double geodesic flow was applied after dividing the tongue image into two parts based on previous knowledge of tongue shape and location. The result showed low error and good true positive volume fraction (98%) compared to other works. But because of expensive computational time, it is not feasible for real time solution. Moreover, the system is not full-proof for background separation in case of irregular tongue images. Later, the work continued with color control-geometric and gradient flow snake (C2G2FSnake) algorithm for fully automated tongue segmentation, keeping the number of classifications and branches same.75 The dataset included 30 images. This method enhanced the curve velocity. Though the work showed good accuracy and less complexity, it needed four points to be specified for initial contour formation. Chen et al61 performed tongue image segmentation utilizing the same dataset via MATLAB and the test result showed 98.4% accuracy taking 11.46 seconds to compute with C2G2FSnake. Testing on 40 images, recent work has been reported to achieve 75% accuracy.80

3.5. Watershed transformation

The word watershed signifies a ridge that divides areas drained by different river systems. The geographical area draining into a water source, for example, river or reservoir is called the catchment basin. The watershed algorithm is adaptable to various kinds of images, for example, blood cells, stars, toner spots on a printed page, DNA microarray elements. This segmentation algorithm is capable to differentiate incredibly complex images. However, the performance depends on correct choice of markers to avoid oversegmentation. The watershed transform is also utilized as a segmentation technique for tongue diagnosis.506181

A possible route for watershed transform on tongue could be contrast-limited adaptive histogram equalization (after preprocessing), thresholding, filtering, and then overlaying the perimeter as shown in Fig. 4. The last image of Fig. 4 is where watershed algorithm was employed in this work and this was introduced by Eddins82 for cell segmentation with microscopic images. The image does not contain the anticipated textural information. The region of interest is cropped and the rest of the image information is not useful.

Snake models are often combined with watershed transform to produce better edge detection. Wu et al81 used such combination on 120 images, where the initial contour was generated using watershed transform whereas the active contour model was used to converge to the exact edge. However, there may not be a clear edge border for tongue images in natural setting like the ones used in this work. Taking RGB tongue images as input, Ning et al50 sequentially used gradient vector flow (GVF), watershed transformation, and then an interactive region merging method called maximal similarity based region merging (MSRM) and finally snake model for refinement. The idea was to avert oversegmentation of watershed as GVF can well preserve main edge structures while removing trivial structures.

3.6. Tongue shape based analysis

In order to analyze the shape of the tongue, one may require contour extraction and tongue shape correction. Zhang and Zhang23 used decision tree to classify five different types of tongue shapes among 130 healthy and 542 diseased people. They included 13 geometric features. Their work outline is sketched in Fig. 5.


Huang et al40 corrected the tongue deflection based on three geometric categories and analyzed tongue shape based on seven geometric features. The Analytic Hierarchy Process (AHP) was utilized for tongue classification by computing relative influences of different parameters such as length, area, and angle factor. Each AHP module represented each tongue shape class. The ambiguity and impression between the quantitative features and the shape classes were presented by the fuzzy fusion framework. This framework combined seven AHP modules. The study included 362 tongue samples and the result showed success to decrease tongue shape deflection. The classification accuracy was 90.3%. The authors compared the result with kNN83 and linear discriminant analysis,99 where the accuracy was 78.2% and 82.9%, respectively. Although their study includes unhealthy tongues, the correlations between disease types and tongue shapes are not taken into account.

Go to:

4. Disease classification

Tongue diagnosis deals with syndrome, rather than disease itself. Xu et al84 classified syndromes using machine learning techniques. Another syndrome classification-based work, conducted by Zhao et al,85 focused on searching for its correlation with viral hepatitis. Kim et al58 utilized statistical analysis to prove that the self-reported Yin deficient patients may have more redness in tongue and less tongue coating in comparison to non-Yin-deficient control group. Statistical analysis was further utilized to determine the relationship between ischemic stroke with and without retroflex tongue among 308 patients.86 A statistical analysis was utilized by Kim et al87 to track the treatment of functional dyspepsia. This work analyzed the change in the Nepean Dyspepsia Index scores to indicate the primary outcome. The baseline and the images taken after four weeks were examined to achieve this goal. More parameters (such as tongue coating thickness) were added to find out a few secondary outcomes.

Effective CDSS may be yet to be established, but there is no denial that CDSS has the potential to improve healthcare by linking health observations with health knowledge to influence health choices by clinicians. The diagnosis decision support systems (DDSS) is a specialized CDSS for diagnosis that requests for the patients data, for example, questionnaires, images, previous medical record. In response to the request, the system provides a disease decision or proposes a set of appropriate diagnoses. DDSS are becoming popular day by day and is being tested in dynamic scenario.8889

Zhang et al20 presented a Bayesian network classifier-based system to diagnose pulmonary heart disease, appendicitis, gastritis, pancreatitis, and bronchitis with about 75% accuracy. Their system works in real-time to point out quantitative features from tongue images. They used Support Vector Regression (SVR) for color correction and Bayesian classifier for chromatic and textural measuring. Their work included 544 patients and 56 healthy subjects. The diagnosis accuracy was found to be 100% for the healthy class. The result was not promising for diseases such as nephritis, gastroduodenal perforation, and abdominal tuberculosis. Though accuracy for Leukemia was only 67.6% and the sample size was 37, more attention can be drawn toward such cancer diagnosis.

Abe et al90 tried to establish the relationship between tongue coating and aspiration pneumonia. The tongue plaque index (TPI) was utilized to investigate the association of selected oral bacteria present in saliva and tongue-coating. The subjects were 71 edentulous elderly aged over 65 years. The outcome suggested that tongue-coating can be used as a risk indicator for edentate (incisor and canine toothless) subjects to detect aspiration pneumonia.

Han et al31 investigated tongue coating images as a probable tool for a colorectal cancer diagnosis. They appraised tongue images captured by a specialized image acquisition device to study the impact on coating thickness in the presence of responsible microbial particle. The result showed clear variation between microbial community structures in case of patients suffering from colorectal cancer. The presented analysis indicates that tongue coating analysis may be a novel potential biomarker for colorectal cancer diagnosis. Han et al8 further extended their study with improved sample size for early diagnosis of different types of cancer. Their study showed that there was a color variation between healthy and cancer tongues, one was reddish while the other was purple respectively. The cancer patients’ tongues lack in relative abundance of bacterial microorganisms such as NeisseriaHaemophilusFusobacterium, and Porphyromonas. The work indicated toward a possible cancer screening and early diagnosis method through tongue and tongue coating analysis.

Zhang et al22 used tongue color gamut on 1045 images to differentiate between healthy tongue and tongue with disease and to diagnose different diseases including chronic kidney disease, diabetes nephritis, hypertension, verrucous and erosive gastritis, pneumonia, nephritic syndrome, chronic cerebral circulation insufficiency, upper respiratory tract infection, coronary heart disease, chronic bronchitis, and mixed hemorrhoid. They used k-NN and SVM to find whether the subject is healthy or not. Both of these techniques provided 91.99% classification accuracy. Later on, clustering was performed on 11 diseases with 70% accuracy. Though SVM and k-NN both show similar outcome for clustering, SVM performs better. For both cases, diabetes and hypertension classification result are poor.

Zhang and Zhang23 conducted quantitative analysis on 672 images to distinguish between healthy and diseased tongue and to diagnose diabetes mellitus, different gastritis, nephritis, and coronary heart disease. Samples were collected from Traditional Chinese Medicine Hospital but the images were classified based on western medical practice. The decision tree was used to classify among five different types of tongue shapes, SVM was used to classify diseases for each tongue shape utilizing 13 geometric features, and number of features were optimized by Sequential Forward Selection (SFS). They also used k-NN but it gave poor result. The average accuracy of disease classification is 76.24%. In addition to tongue shape and geometric features, fusion of other features such as tongue color, fur, and fissure could be explored for better diagnosis of the diseases.

With an aim to diagnose diabetes, tongue image information of total 827 subjects, both diabetic and non-diabetic obtained from TDA-1 digital tongue instrument were analyzed.91 Tongue body and coating separation, color, and textural features were examined by division merging, chrominance-threshold, SVM, and few other algorithms. After sample equalization and feature normalization, 23 input parameters including information of the subject, tongue color, and texture PCA were used to reduce the dimensions of the feature. Optimizing the kernel parameter by GA, SVM showed 78.77% accuracy for diabetes prediction. Though the prediction accuracy is low, the work carries clear indication about the potential of tongue diagnosis for diabetes detection. In future, inclusion of other tongue features may increase the accuracy.

Inspired by deep convolutional neural network (CNN), a feature extraction technique named constrained high dispersal neural networks was implemented on tongue images of 315 people.92 The objective of this feature extraction was to separate healthy and unhealthy class. A weighted LIBLINEAR SVM was trained to perform the task, which showed 91.14% accuracy. The authors claimed the system to be faster than CNN; however, to be implemented in real-time, one has to be careful about using deep neural network, especially when the accuracy is still low and the system cannot provide decision on specific disease.

In recent years, researchers have been working on the ATD. But most of them are concerned only up to feature extraction stage. On the other hand, CDSS-based works paid an inadequate attention on the prior steps involved, which raises the issue of compatible standardization. Besides, the limited work done on tongue diagnosis-based disease detection is not on the same diseases. Thus, it becomes hard to compare the accuracy and repeatability of the best decision support system found in this field. Moreover, the reported works suggest the accuracy slightly under 80%, which may not be acceptable in many cases of CDSSs.

There are few works93 done on early stage breast cancer (BC) detection. Nine tongue features of both breast cancer patient (stage 0 and 1) and healthy persons were investigated in a hope to diagnose BC at an early stage to ensure timely treatment to increase the likelihood of recovery, lowering the relapse rate. The considered features are tongue color, quality, fur, fissure, red dot, ecchymosis, tooth mark, saliva, and tongue shape. The subdivision of the extracted features according to the corresponding organs such as spleen–stomach, liver–gall-left, liver–gall-right, kidney, and heart–lung area are illustrated in Fig. 6.

The data of 57 early-stage BC patients and 60 healthy people were utilized for training, whereas the data of 10 early-stage BC patients and 10 healthy people were applied for testing. The tongue features along with Mann–Whitney test were exploited to perform the logistic regression. Though the result is not good for the early stage or potential cancer patient, more feature extraction techniques as well as different features could be explored to attain better accuracy. The accuracy for healthy tongue was varied from 80% to 90%. Higher accuracy was attained using lesser number of features. The work was further upgraded without any significant change in the result.93

A summary of algorithms used in disease diagnosis is provided in Table 3.

5. Mobile-enabled tongue diagnosis schemes

In 2009, American Recovery and Reinvestment Act encouraged widespread adoption of health information technology (HIT) via Health Information Technology for Economic and Clinical Health Act (HITECH). Gradually these HITs are becoming more robust and diverse. Disease diagnosis on a mobile platform has gained the attention of researchers and developers in the last few years.95

Though available smartphone technology offers enormous prospect to employ tongue diagnosis for disease classification, very few work has been done exploiting existing means. To authors’ best knowledge, only one mobile application is available in iOS and android platform called i-Tongue © University of Missouri.96 Because of openness, total interface customization, universality, security, few more tongue diagnosis applications are initiated focusing android platform than iOS.214148

The research work conducted by Otsu97 and Hsu et al54 was taken under consideration by Hu et al,41 for tongue region segmentation and tongue diagnosis, and the algorithm was tested in smartphones such as Samsung Galaxy S2 and S3, HTC Sensation, and J Z32 providing similar outputs and server running in PC is able to perform analysis of each image taking below 3 seconds. Hu et al pointed out that most of the mobile phone camera other than tongue with any kind of deformity this work is promising for fur and fissure detection. Though based on this work’s output, the team is working on liver disease diagnosis, and this work does not include any decision support system and thus predominantly relies on a physician’s opinion. Zhang et al21 used CCD camera to outline tongue via canny algorithm and then utilized feature extraction to diagnose diseases.

Taking teeth color as a standard, Ini98 presented a smartphone-based tongue color calibration method. 20 female subjects were chosen for the study, continued for a month. K-means algorithm was used to detect tongue coating differentiating from other body parts. However, the distinguishing method itself was unfitting to start with.

Taking lighting condition into account, Hu et al48 used a smartphone to calculate SVM-based color correction matrix and to automatically detect fur and fissure of tongue. The lighting environment included with and without flashlights. This work focused on detection accuracy, but robustness was not explored.

Like most diagnosis-based health and fitness mobile applications, iTongue © University of Missouri96 is available for both guest and registered users in google play and apple app store. The height (cm) and weight (kg) of the user has to be provided during registration. There is a series of questions users must provide answer to; otherwise no result will be generated. There are some additional questions for registered users; few of them are gender-specific. Using these answers, the application generates the result and recommendations including constitute of qi asthenia, yang asthenia, yin asthenia, phlegm-dampness, and damp-heat. Each constitute can recommend environment, exercise, emotion, and diet. The guest version cannot store any images. The application removes the image when the user tries to take another picture. There is (xy) axis to guide the user about tongue exposure in front of the phone camera. The registered users can save the history and use stored images from the phone. Image segmentation, feature extraction, and machine learning techniques are used to process the result. The user can request for manual assessment by TCM professionals with a fee. The current version 2.0.2 is an update released on Sep 14, 2016 requires minimum android 2.2 or iOS 5.1.1 and can be operated in English, Simplified Chinese, and Traditional Chinese. The update includes sharing features as well. The application is intended for an auxiliary diagnosis with questionable accuracy and reliability.

A mobile enabled system for tongue diagnosis without any human intervention is outlined in Tania et al2 (Fig. 7). Such a system would comprise image processing and machine learning algorithms to act as a standalone system. However, the implementation on mobile platform was not included in the paper.

6. Proposed framework and discussion

On the basis of our study, we have identified the research gaps to be addressed to develop an intelligent tongue diagnosis system. They are summarized as below.

  • Unlike the western research convention, it is not a common practice to deposit the classified authentic tongue images in an open access database, thereby limiting the scope of improvement. There should be benchmark datasets of classified tongue images in the open access database to broaden the horizon of tongue diagnosis. Without a benchmark dataset, it is hard to perform comparable experiments, verify, validate, or improve the results.
  • There is a lack of overall consistency in the ATD systems including characteristics of the input image, for example, image quality, design guideline, image segmentation, and feature extraction. Thus, the accuracy, robustness, and reliability are inevitably improbable.
  • There is an infrequency of interchangeable scheme, making it incomprehensible to utilize the best found result from the prior step as an input for the subsequent step for different work.
  • To the best of our knowledge, there is no complete work (i.e., starting from the light estimation to CDSS) that has been conducted in the literature.

The tongue diagnosis requires more autonomy to reach its full potential and ensure its widespread application in the digital health system. On the basis of the work done in the literature, a conceptual diagram is illustrated in Fig. 8 as a completely ATD system using CDSS, independent of human expert involvement. The idea is to incorporate disease detection with extracted features from tongue diagnosis in a mobile enabled platform (Fig. 7).

The commercial health applications, for example, iPhone health app usually provides provision for manual input regarding symptoms. The manual input of disease symptoms can be based on selected diseases. Any of the standard questionnaire set, for example, TCM, Kampo can be utilized. A polythetic approach on the mobile platform should consider the symptoms provided by the user with the color, texture, and geometric features.

With the improvement of hardware, preprocessing requirements are reducing day by day. The commercially available mobile device possesses camera resolution as high as 12–16 megapixel, with F1.7 lens. Higher focus and built-in automatic adjustment features are narrowing down, and the necessity of light estimation and color correction is abridging or nullifying. Moreover, a strong image processing algorithm can often manage the lighting condition by itself. The extracted features (e.g., fur, texture, shape), subsequent to image segmentation, can be utilized for classification. All these information, including the symptoms, need to be fused together by a fusion algorithm to provide the final result. The conceptual diagram can be trained offline and the whole diagnosis system can be deployed as a smartphone application to avail the system as a homecare or mobile setting (Fig. 7).

7. Conclusion

This paper explored the standardized and automated tongue diagnosis systems to demonstrate its potential. The investigation is in favor of tongue diagnosis to make it an integrated part of auxiliary diagnosis system within the primary healthcare system and an early diagnostic tool. Because the chromatic, textural and geometric shape based analysis of tongue projects indispensable information about health status. Remarkable work has already been done on different steps, for example, tongue image segmentation, background–foreground separation, healthy–unhealthy classification, and few specific disease-related works. This work explored each of these steps in the literature, especially focusing on the algorithms. Identifying some general trends, this section broadly summarizes the research gap.

While evaluating the prospect of tongue diagnosis, the absence of CDSS was noticeable. Our study indicated that the ATD embracing a CDSS can open the door for standalone systems, rather than relying on limited TCM experts only. The recent advancement in the field of camera of smart devices, classifiers, and CDSS algorithms present the opportunity to develop a real-time framework and standard protocol for everyone to be followed so that collective knowledge can be built on existing one. However, it was also noticeable from our survey that the transition from one step to another is incomprehensible due to ‘casual’ diversity in practice. Thus, the need for standardization is inevitable from the literature, as everyone is defining their own system for various steps but in most cases, there is no way to put them together. To proceed with the research on tongue diagnosis, undeniably there is a need for an open access authentic dataset with classified images of tongue.

The volume of work done in the literature does not combine the overall system to make it human intervention-free. The literature reflected the lack of a complete standalone system from capturing the tongue picture to attain the disease diagnosis. On the basis of the literature review, this work proposed an integrated framework to develop such a system. The derivation of general recommendations may help those who intend to bring tongue diagnosis into modern technology enabled practice.

Acknowledgements

The research work has been funded by Erasmus Mundus Partnerships Action 2 “FUSION” (Featured eUrope and South asIa mObility Network) project of Erasmus Mundus. Grant reference number: 2013-3254 1/001001.

References

1. Contreras-naranjo J.C., Wei Q., Ozcan A. Mobile phone-based microscopy, sensing, and diagnostics. IEEE J Sel Top Quantum Electron. 2016;22:1–14. [Google Scholar]

2. Tania M.H., Lwin K.T., Hossain M.A. 2016 10th International Conference on Software, Knowledge, Information Management & Applications (SKIMA). Chengdu: IEEE. 2016. Computational complexity of image processing algorithms for an intelligent mobile enabled tongue diagnosis scheme; pp. 29–36. [Google Scholar]

3. Kim J., Han G., Ko S.J., Nam D.H., Park J.W., Ryu B. Tongue diagnosis system for quantitative assessment of tongue coating in patients with functional dyspepsia: a clinical trial. J Ethnopharmacol. 2014;155:709–713. [PubMed] [Google Scholar]

4. Jung C.J., Kim K.H., Jeon Y.J., Kim J. Improving color and shape repeatability of tongue images for diagnosis by using feedback gridlines. Eur J Integr Med. 2014;6:328–336. [Google Scholar]

5. Jung C.J., Jeon Y.J., Kim J.Y., Kim K.H. Review on the current trends in tongue diagnosis systems. Integr Med Res. 2012;1:13–20. [PMC free article] [PubMed] [Google Scholar]

6. Yamamoto S., Tsumura N., Nakaguchi T., Namiki T., Kasahara Y., Terasawa K. Regional image analysis of the tongue color spectrum. Int J Comput Assist Radiol Surg. 2011;6:143–152. [PubMed] [Google Scholar]

7. Su W., Xu Z.Y., Wang Z.Q., Xu J.T. Objectified study on tongue images of patients with lung cancer of different syndromes. Chin J Integr Med. 2011;17:272–276. [PubMed] [Google Scholar]

8. Han S., Yang X., Qi Q. Potential screening and early diagnosis method for cancer: tongue diagnosis. Int J Oncol. 2016;48:2257–2264. [PMC free article] [PubMed] [Google Scholar]

9. Pang B., Zhang D., Li N., Wang K. Computerized tongue diagnosis based on Bayesian networks. IEEE Trans Biomed Eng. 2004;51:1803–1810. [PubMed] [Google Scholar]

10. Jiang B., Liang X., Chen Y., Ma T., Liu L., Li J. Integrating next-generation sequencing and traditional tongue diagnosis to determine tongue coating microbiome. Sci Rep. 2012;2:936. [PMC free article] [PubMed] [Google Scholar]

11. Cheng T.L., Lo L.C., Huang Y.C., Chen Y.L., Wang J.T. Analysis of agreement on traditional Chinese medical diagnostics for many practitioners. Evid-based Complem Altern Med. 2012;2012 [PMC free article] [PubMed] [Google Scholar]

12. Reddington A.P., Trueb J.T., Freedman D.S., Tuysuzoglu A., Daaboul G.G., Lopez C.A. An interferometric reflectance imaging sensor for point of care viral diagnostics. IEEE Trans Biomed Eng. 2013;60:3276–3283. [PMC free article] [PubMed] [Google Scholar]

13. Switz N.A., D’Ambrosio M.V., Fletcher D.A. Low-cost mobile phone microscopy with a reversed mobile phone camera lens. PLOS ONE. 2014;9:e95330. [PMC free article] [PubMed] [Google Scholar]

14. Skandarajah A., Reber C.D., Switz N.A., Fletcher D.A. Quantitative imaging with a mobile phone microscope. PLOS ONE. 2014;9:e96906. [PMC free article] [PubMed] [Google Scholar]

15. Smith Z.J., Chu K., Espenson A.R., Rahimzadeh M., Gryshuk A., Molinaro M. Cell-phone-based platform for biomedical device development and education applications. PLOS ONE. 2011;6:e17150. [PMC free article] [PubMed] [Google Scholar]

16. Bogoch I.I., Andrews J.R., Speich B., Utzinger J., Ame S.M., Ali S.M. Mobile phone microscopy for the diagnosis of soil-transmitted helminth infections: a proof-of-concept study. Am J Trop Med Hyg. 2013;88:626–629. [PMC free article] [PubMed] [Google Scholar]

17. Petersen C., Chen T., Ansermino J., Dumont G. Design and evaluation of a low-cost smartphone pulse oximeter. Sensors. 2013;13:16882–16893. [PMC free article] [PubMed] [Google Scholar]

18. Daaboul G.G., Lopez C.A., Yurt A., Goldberg B.B., Connor J.H., Ünlü M.S. Label-free optical biosensors for virus detection and characterization. IEEE J Sel Topics Quant Electron. 2012 [Google Scholar]

19. Lu J., Yang Z., Okkelberg K., Ghovanloo M. Joint magnetic calibration and localization based on expectation maximization for tongue tracking. IEEE Trans Biomed Eng. 2017;65:52–63. [PMC free article] [PubMed] [Google Scholar]

20. Zhang H.Z., Wang K.Q., Zhang D., Pang B., Huang B. Computer aided tongue diagnosis system. 2005 IEEE Engineering in Medicine and Biology 27th Annual Conference, vol. 7; Shanghai; 2005. pp. 6754–6757. [PubMed] [Google Scholar]

21. Zhang Q., Shang H.L., Zhu J.J., Jin M.M., Wang W.X., Kong Q.S. A new tongue diagnosis application on android platform. Proceedings – 2013 IEEE International Conference on Bioinformatics and Biomedicine, IEEE BIBM 2013; Shanghai; 2013. pp. 324–327. [Google Scholar]

22. Zhang B., Wang X., You J., Zhang D. Tongue color analysis for medical application. Evid-based Complem Alternat Med. 2013;2013:264742. [PMC free article] [PubMed] [Google Scholar]

23. Zhang B., Zhang H. Significant geometry features in tongue image analysis. Evid-based Complem Alternat Med. 2015;2015:1–8. [PMC free article] [PubMed] [Google Scholar]

24. Cibin N.V., Franklin S.W., Nadu T. Diagnosis of diabetes mellitus and NPDR in diabetic patient from tongue images using LCA classifier. Int J Adv Res Trends Eng Technol. 2015;II:57–62. [Google Scholar]

25. Chiu C.C. A novel approach based on computerized image analysis for traditional Chinese medical diagnosis of the tongue. Comput Methods Programs Biomed. 2000;61:77–89. [PubMed] [Google Scholar]

26. Jang J.H., Kim J.E., Park K.M., Park S.O., Chang Y.S., Kim B.Y. Proc Second Jt 24th Annu Conf Annu Fall Meet Biomed Eng Soc [Engineering Med Biol.], vol. 2. 2002. Development of the digital tongue inspection system with image analysis; pp. 1033–1034. [Google Scholar]

27. Li C.H., Yuen P.C. Tongue image matching using color content. Pattern Recognit. 2002;35:407–419. [Google Scholar]

28. Wang X., Zhang D. An optimized tongue image color correction scheme. IEEE Trans Inf Technol Biomed. 2010;14:1355–1364. http://ieeexplore.ieee.org/stamp/stamp.jsp?tp=&arnumber=5570961 [PubMed] [Google Scholar]

29. Kim M., Cobbin D., Zaslawski C. Traditional Chinese medicine tongue inspection: an examination of the inter- and intrapractitioner reliability for specific tongue characteristics. J Altern Complem Med. 2008;14:527–536. [PubMed] [Google Scholar]

30. Jiang L., Xu W., Chen J. Digital imaging system for physiological analysis by tongue colour inspection. 2008 3rd IEEE Conference on Industrial Electronics and Applications; Singapore; 2008. pp. 1833–1836. [Google Scholar]

31. Han S., Chen Y., Hu J., Ji Z. Tongue images and tongue coating microbiome in patients with colorectal cancer. Microb Pathog. 2014;77:1–6. [PubMed] [Google Scholar]

32. Zhi L., Zhang D., Yan J.qi, Li Q.L., Tang Q.lin. Classification of hyperspectral medical tongue images for tongue diagnosis. Comput Med Imaging Graph. 2007;31:672–678. [PubMed] [Google Scholar]

33. Li Q., Liu Z. Tongue color analysis and discrimination based on hyperspectral images. Comput Med Imaging Graph. 2009;33:217–221. [PubMed] [Google Scholar]

34. Li Q. 2008 2nd Int Conf Bioinforma Biomed Eng. 2008. Hyperspectral imaging technology used in tongue diagnosis; pp. 2579–2581. [Google Scholar]

35. Li Q., Wang Y., Liu H., Guan Y., Xu L. Sublingual vein extraction algorithm based on hyperspectral tongue imaging technology. Comput Med Imaging Graph. 2011;35:179–185. [PubMed] [Google Scholar]

36. Jiang C., Luo C., Yu J., Li R., Wang Z. 2014 IEEE Int Conf Multimed Expo Work, ICMEW. 2014. Modeling a realistic 3D physiological tongue for visual speech synthesis; pp. 2–7. [Google Scholar]

37. Jian Z., Lijuan S., Lirong W., Qinsheng D., Yajuan S. 2012 Fifth Int Conf Intell Networks Intell Syst. 2012. Dynamic extraction method of 3D parameters of tongue for pronunciation recovery about impaired hearing children; pp. 340–343. [Google Scholar]

38. Lv H., Cai Y., Guo S. Int Conf Signal Process Proceedings, ICSP, vol. 3. 2012. 3D reconstruction of tongue surface based on photometric stereo; pp. 1668–1671. [Google Scholar]

39. Liu Z., Wang H., Xu H., Song S. 3D tongue reconstruction based on multi-view images and finite element. Adv Inf Sci Serv Sci. 2011;3 [Google Scholar]

40. Huang B., Wu J., Zhang D., Li N. Tongue shape classification by geometric features. Inf Sci (NY) 2010;180:312–324. [Google Scholar]

41. Hu M.-C., Cheng M.-H., Lan K.-C. Color correction parameter estimation on the smartphone and its application to automatic tongue diagnosis. J Med Syst. 2016;40:18. [PubMed] [Google Scholar]

42. McCamy C., Marcus H., Davidson J. A color-rendition chart. J Appl Photog Eng. 1976;2:95–99. [Google Scholar]

43. Wang Y., Zhou Y., Yang J., Xu Q. An image analysis system for tongue diagnosis in traditional Chinese medicine. In: Zhang J., He J.-H., Fu Y., editors. Computational and Information Science: First International Symposium, CIS 2004, Shanghai, China, December 16–18, 2004. Proceedings. Springer Berlin Heidelberg; Berlin, Heidelberg: 2005. p. 1181-1186. [Google Scholar]

44. Liu Z., Li Q., Yan J., Tang Q. A novel hyperspectral medical sensor for tongue diagnosis. Sens Rev. 2007;27:57–60. [Google Scholar]

45. Cai Y.C.Y. IMTC/2002 Proc 19th IEEE Instrum Meas Technol Conf (IEEE Cat No00CH37276), vol. 1. 2002. A novel imaging system for tongue inspection; pp. 21–23. [Google Scholar]

46. Kamarudin NDi, Ooi C.Y., Kawanabe T., Odaguchi H., Kobayashi F. A fast SVM-based tongue’s colour classification aided by k-means clustering identifiers and colour attributes as computer-assisted tool for tongue diagnosis. J Healthc Eng. 2017;2017 [PMC free article] [PubMed] [Google Scholar]

47. Wang X., Zhang B., Yang Z., Wang H., Zhang D. Statistical analysis of tongue images for feature extraction and diagnostics. IEEE Trans Image Process. 2013;22:5336–5347. [PubMed] [Google Scholar]

48. Hu M.-C., Zheng G.-Y., Chen Y.-T., Lan K.-C. Automatic tongue diagnosis using a smart phone. 2014 IEEE International Conference on Systems, Man, and Cybernetics; San Diego, CA, USA; 2014. [Google Scholar]

49. Zhong X., Fu H., Yang J., Wang W. 8th IEEE Int Symp Dependable, Auton Secur Comput DASC 2009. 2009. Automatic segmentation in tongue image by mouth location and active appearance model; pp. 413–417. [Google Scholar]

50. Ning J., Zhang D., Wu C., Yue F. Automatic tongue image segmentation based on gradient vector flow and region merging. Neural Comput Appl. 2012;21:1819–1826. [Google Scholar]

51. Zhu M., Du J., Ding C. A comparative study of contemporary color tongue image extraction methods based on HSI. Int J Biomed Imaging. 2014;2014 [PMC free article] [PubMed] [Google Scholar]

52. Zhu M.F., Du J.Q., Zhang K., Ding C.H. A novel approach for tongue image extraction based on combination of color and space information. 2009 3rd International Conference on Bioinformatics and Biomedical Engineering; Beijing; 2009. pp. 1–4. [Google Scholar]

53. Liang C., Shi D. Proceedings – 2012 International Conference on Computer Science and Electronics Engineering, ICCSEE 2012, vol 2. Hangzhou. 2012. A prior knowledge-based algorithm for tongue body segmentation; pp. 646–649. [Google Scholar]

54. Hsu Y., Chen Y., Lo L., Chiang J.Y., Calibration A.C. Automatic tongue feature extraction. 2010 International Comput Symp, ICS2010; Tainan; 2010. pp. 936–941. [Google Scholar]

55. Jian-Qiang D., Yan-Sheng L., Ming-Feng Z., Kang Z., Cheng-Hua D. BioMedical Engineering and Informatics: New Development and the Future – Proceedings of the 1st International Conference on BioMedical Engineering and Informatics, BMEI 2008, vol. 1. Sanya. 2008. A novel algorithm of color tongue image segmentation based on HSI; pp. 733–737. [Google Scholar]

56. Li W., Hu S., Wang S., Xu S. Towards the objectification of tongue diagnosis: Automatic segmentation of tongue image. Industrial Electronics, 2009. IECON’09. 35th Annual Conference of IEEE; Porto; 2009. pp. 2121–2124. [Google Scholar]

57. Chen L., Wang B., Zhang Z., Lin F., Ma Y. Research on techniques of multifeatures extraction for tongue image and its application in retrieval. Comput Math Methods Med. 2017;2017:8064743. [PMC free article] [PubMed] [Google Scholar]

58. Kim S., Choi W., Yeo I., Nam D. Comparative analysis of tongue indices between patients with and without a self-reported yin deficiency: a cross-sectional study. Evid-based Complem Altern Med. 2017;2017:1279052. [PMC free article] [PubMed] [Google Scholar]

59. Kawanabe T., Kamarudin N.D., Ooi C.Y., Kobayashi F., Mi X., Sekine M. Quantification of tongue colour using machine learning in Kampo medicine. Eur J Integr Med. 2016 [Google Scholar]

60. Pang B., Zhang D., Wang K. Tongue image analysis for appendicitis diagnosis. Int J Sci Eng Technol Res. 2015;4:2263–2268. [Google Scholar]

61. Chen L., Wang D., Liu Y., Gao X., Shang H. A novel automatic tongue image segmentation algorithm: color enhancement method based on L*a*b* color space. 2015 IEEE International Conference on Bioinformatics and Biomedicine (BIBM); Washington, DC: IEEE; 2015. pp. 990–993. [Google Scholar]

62. Geng X. Label Distribution Learning. IEEE Trans Knowl Data Eng. 2014;4347:1–14. [Google Scholar]

63. Jung C., Kim K., Ku B., Kim J. Trends in tongue color of subtype patterns on deficiency syndrome. Integr Med Res. 2015;4:29. [Google Scholar]

64. Amato F., López A., Peña-Méndez E.M., Vaňhara P., Hampl A., Havel J. Artificial neural networks in medical diagnosis. J Appl Biomed. 2013;11:47–58. [Google Scholar]

65. Barbosa D.C., Roupar D.B., Ramos J.C., Tavares A.C., Lima C.S. Automatic small bowel tumor diagnosis by using multi-scale wavelet-based analysis in wireless capsule endoscopy images. Biomed Eng Online. 2012;11:3. [PMC free article] [PubMed] [Google Scholar]

66. Li J., Xu B., Ban X., Tai P., Ma B. A tongue image segmentation method based on enhanced HSV convolutional neural network. In: Luo Y., editor. Cooperative Design, Visualization, and Engineering: 14th International Conference, CDVE 2017. Mallorca, Spain, September 17–20, 2017, Proceedings. Springer International Publishing; Cham: 2017. pp. 252–260. [Google Scholar]

67. Cheung V., Westland S., Connah D., Ripamonti C. A comparative study of the characterisation of colour cameras by means of neural networks and polynomial transforms. Color Technol. 2004;120:19–25. [Google Scholar]

68. Zhuo L., Zhang P., Qu P., Peng Y., Zhang J., Li X. A K-PLSR-based color correction method for TCM tongue images under different illumination conditions. Neurocomputing. 2016;174:815–821. [Google Scholar]

69. Zhu M., Du J., Zhang K., He Y., Ding C. Research of tongue color recognition based on BP-ANN with self-adaptive network structure. Proceedings – 2015 7th International Conference on Information Technology in Medicine and Education, ITME 2015; Huangshan; 2016. pp. 208–211. [Google Scholar]

70. Gui M., Zhang X., Hu G., Zhang C., Zhang Z. 8th Int Conf Biomed Eng Informatics (BMEI 2015) 2015. A study on tongue image color description based on label distribution learning; pp. 148–152. [Google Scholar]

71. Deng Y., Manjunath B.S. Unsupervised segmentation of color-texture regions in images and video. IEEE Trans Pattern Anal Mach Intell. 2001;23:800–810. [Google Scholar]

72. Deng Y.D.Y., Kenney C., Moore M.S., Manjunath B.S. ISCAS’99 Proc 1999 IEEE Int Symp Circuits Syst VLSI (Cat. No. 99CH36349), vol. 4. 1999. Peer group filtering and perceptual color image quantization; pp. 21–24. [Google Scholar]

73. Canny J. A computational approach to edge detection. IEEE Trans Pattern Anal Mach Intell. 1986;8:679–698. [PubMed] [Google Scholar]

74. Kanawong R., Xu D. 2011 IEEE 13th International Conference on E-Health Networking, Applications and Services. IEEE. 2011. An automatic tongue detection and segmentation framework for computer-aided tongue image analysis; pp. 189–192. [Google Scholar]

75. Shi M.J., Li G.Z., Li F.F. C2G2FSnake: automatic tongue image segmentation utilizing prior knowledge. Sci China Inf Sci. 2013;56:1–14. [Google Scholar]

76. Xu W., Kanawong R., Xu D., Li S., Ma T., Zhang G. An automatic tongue detection and segmentation framework for computer-aided tongue image analysis. 2011 IEEE 13th International Conference on E-Health Networking, Applications and Services, HEALTHCOM 2011; Columbia, MO: IEEE; 2011. pp. 189–192. [Google Scholar]

77. Kass M., Witkin A., Terzopoulos D. Snakes: active contour models. Int J Comput Vis. 1988;1:321–331. [Google Scholar]

78. Zhai X.M., Lu H.D., Zhang L.Z. Application of image segmentation technique in tongue diagnosis. Proceedings – 2009 International Forum on Information Technology and Applications, IFITA 2009, vol. 2; Chengdu; 2009. pp. 768–771. [Google Scholar]

79. Shi M., Li G.Z., Li F., Xu C. A novel tongue segmentation approach utilizing double geodesic flow. ICCSE 2012 – Proceedings of 2012 7th International Conference on Computer Science and Education; Melbourne, VIC; 2012. pp. 21–25. [Google Scholar]

80. Faundra M.R., Ratna D., Yang X., Liu C., Ringenberg J., Deo M. IOP Conference Series: Materials Science and Engineering, vol. 755. 2016. Tongue segmentation using active contour model; p. 11001. [Google Scholar]

81. Wu J., Zhang Y., Bai J. Tongue area extraction in tongue diagnosis of traditional chinese medicine. Conference Proceedings: Annual International Conference of the IEEE Engineering in Medicine and Biology Society. IEEE Engineering in Medicine and Biology Society Conference, vol. 5; Shanghai; 2005. pp. 4955–4957. [PubMed] [Google Scholar]

82. Eddins S. 2006. Cell segmentation. MathWorks. Website: http://blogs.mathworks.com/steve/2006/06/02/cell-segmentation [accessed 08.02.17] [Google Scholar]

83. Madkour a., Hossain M.a., Dahal K.P., Yu H. Intelligent learning algorithms for active vibration control. IEEE Trans Syst Man Cybern C: Appl Rev. 2007;37:1022–1033. [Google Scholar]

84. Xu J., Xu Z., Lu P., Guo R., Yan H., Xu W. Classifying syndromes in Chinese medicine using multi-label learning algorithm with relevant features for each label. Chin J Integr Med. 2016;22:867–871. [PubMed] [Google Scholar]

85. Zhao Y., He L., Liu B., Li J., Li F., Huo R. Syndrome classification based on manifold ranking for viral hepatitis. Chin J Integr Med. 2014;20:394–399. [PubMed] [Google Scholar]

86. Huang Y., Sun M., Hsu P., Chen Y., Chiang J.Y., Lo L. The relationship between ischemic stroke patients with and without retroflex tongue: a retrospective study. Evid-based Complem Altern Med. 2017;2017 [PMC free article] [PubMed] [Google Scholar]

87. Kim J., Kim H., Kim K.H. Effects of Bu-Zhong-Yi-Qi-Tang for the treatment of functional dyspepsia: a feasibility study protocol. Integr Med Res. 2017;6:317–324. [PMC free article] [PubMed] [Google Scholar]

88. Halldorsson B.V., Bjornsson A.H., Gudmundsson H.T., Birgisson E.O., Ludviksson B.R., Gudbjornsson B. A clinical decision support system for the diagnosis, fracture risks and treatment of osteoporosis. Comput Math Methods Med. 2015;2015 [PMC free article] [PubMed] [Google Scholar]

89. Kunjunninair A.P. Clinical decision support system: risk level prediction of heart disease using weighted fuzzy rules and decision tree rules. Cent Eur J Comput Sci. 2012;2 86-86. [Google Scholar]

90. Abe S., Ishihara K., Adachi M., Okuda K. Tongue-coating as risk indicator for aspiration pneumonia in edentate elderly. Arch Gerontol Geriatr. 2008;47:267–275. [PubMed] [Google Scholar]

91. Zhang J., Xu J., Hu X., Chen Q., Tu L., Huang J. Diagnostic method of diabetes based on support vector machine and tongue images. Biomed Res Int. 2017;2017:1–9. [PMC free article] [PubMed] [Google Scholar]

92. Meng D., Cao G., Duan Y., Zhu M., Tu L., Xu D. Tongue images classification based on constrained high dispersal network. Evid-based Complem Altern Med. 2017;2017 [PMC free article] [PubMed] [Google Scholar]

93. Lo L., chien, Cheng T.L., Chen Y.J., Natsagdorj S., Chiang J.Y. TCM tongue diagnosis index of early-stage breast cancer. Complem Ther Med. 2015;23:705–713. [PubMed] [Google Scholar]

94. Gabhale B., Shinde M., Kamble A., Kulloli M. Tongue image analysis with color and gist features for diabetes diagnosis. Int Res J Eng Technol. 2017;4:523–526. [Google Scholar]

95. Bourouis A., Feham M., Hossain M.A., Zhang L. An intelligent mobile based decision support system for retinal disease diagnosis. Decis Support Syst. 2014;59:341–350. [Google Scholar]

96. Xu D. 2015. iTongue. iTunes. Website: https://itunes.apple.com/gb/app/itongue/id998044356?mt=8 [accessed 30.12.16] [Google Scholar]

97. Otsu N. A threshold selection method from gray-level histograms. IEEE Trans Syst Man Cybern. 1979;9:62–66. [Google Scholar]

98. Ini R. TongueDx: a tongue diagnosis system for personal health care on smartphones. Proceedings of the 5th Augmented Human International Conference, AH’14; New York; 2014. pp. 405–407. [Google Scholar]

99. Xu Y., Yang J.-Y., Jin Z. A novel method for fisher discriminant analysis. Pattern Recognit. 2004;37:381–384. [Google Scholar]

Deep Facial Diagnosis: Deep Transfer Learning From Face Recognition to Facial Diagnosis

Deep Facial Diagnosis: Deep Transfer Learning From Face Recognition to Facial Diagnosis

ABSTRACT The relationship between face and disease has been discussed from thousands years ago, which leads to the occurrence of facial diagnosis. The objective here is to explore the possibility of identifying diseases from uncontrolled 2D face images by deep learning techniques. In this paper, we propose using deep transfer learning from face recognition to perform the computer-aided facial diagnosis on various diseases. In the experiments, we perform the computer-aided facial diagnosis on single (beta-thalassemia) and multiple diseases (beta-thalassemia, hyperthyroidism, Down syndrome, and leprosy) with a relatively small dataset. The overall top-1 accuracy by deep transfer learning from face recognition can reach over 90% which outperforms the performance of both traditional machine learning methods and clinicians in the experiments. In practical, collecting disease-specific face images is complex, expensive and time consuming, and imposes ethical limitations due to personal data treatment. Therefore, the datasets of facial diagnosis related researches are private and generally small comparing with the ones of other machine learning application areas. The success of deep transfer learning applications in the facial diagnosis with a small dataset could provide a low-cost and noninvasive way for disease screening and detection.

INDEX TERMS Facial diagnosis, deep transfer learning (DTL), face recognition, beta-thalassemia, hyperthyroidism, down syndrome, leprosy.

  1. INTRODUCTION

Thousands years ago, Huangdi Neijing [1], the fundamental doctrinal source for Chinese medicine, recorded ‘‘Qi and blood in the twelve Channels and three hundred and sixty-five Collaterals all flow to the face and infuse into the Kongqiao (the seven orifices on the face).’’ It indicates the pathological changes of the internal organs can be reflected in the face of the relevant areas. In China, one experienced doctor can observe the patient’s facial features to know the patient’s whole and local lesions, which is called ‘‘facial diagnosis’’. Similar theories also existed in ancient India and ancient Greece. Nowadays, facial diagnosis refers to that practitioners perform disease diagnosis by observing facial features. The shortcoming of facial diagnosis is that for getting a high accuracy facial diagnosis requires doctors to have a large amount of practical experience. Modern medical researches [11], [12], [30] indicate that, indeed, many diseases will express corresponding specific features on human faces. Nowadays, it is still difficult for people to take a medical examination in many rural and underdeveloped areas because of the limited medical resources, which leads to delays in treatment in many cases. Even in metropolises, limitations including the high cost, long queuing time in hospital and the doctor-patient contradiction which leads to medical disputes still exist. Computer-aided facial diagnosis enables us to carry out non-invasive screening and detection of diseases quickly and easily. Therefore, if facial diagnosis can be proved effective with an acceptable error rate, it will be with great potential. With the help of artificial intelligence, we could explore the relationship between face and disease with a quantitative approach. In recent years, deep learning technology improves the state of the art in many areas for its good performances especially in computer vision. Deep learning inspired by the structure of human brains is to use a multiple-layer structure to perform nonlinear information processing and abstraction for feature learning. It has shown its best performance in ImageNet Large Scale Visual Recognition Challenge (ILSVRC) [42] from 2012. As the challenge progresses, several classic deep neural network models [2]–[6], [36] appeared such as AlexNet, VGGNet, ResNet, Inception-ResNet and SENet. The results of ILSVRCs have fully shown that learning features by deep learning methods can express the inherent information of the data more effectively than the artificial features. Up to now, deep learning has become one of the newest trends in artificial intelligence researches. Face recognition refers to the technology of verifying or identifying the identity of subjects from faces in images or videos. It is a hot topic in the field of computer vision. Face verification is the task of comparing a candidate face to another, and verifying whether it is a match or not. It is a one-to-one mapping. Face identification is the task of matching a given face image to one in a database of faces. It is a one-to-many mapping. These two can be implemented by separate algorithm frameworks, or they can be unified into one framework by metric learning. With the development of deep learning in recent years, traditional face recognition technology has gradually been replaced by deep learning methods. Convolutional Neural Network (CNN) is the most commonly used deep learning method in face recognition. The CNN architectures [7], [8], [27] for face recognition including FaceNet, VGG-Face, DeepFace and ResNet get inspired from those architectures that perform well in ILSVRCs. With the help of a large amount of face images with labels from public face recognition datasets [27], [43], [44], these CNN models are trained for learning most suitable face representations automatically for computer understanding and discrimination [57], and they get a high accuracy when testing on some specific datasets. The success of deep learning in the face recognition area motivates this project. However, the labelled data in the area of facial diagnosis is insufficient seriously. If we train a deep neural network from scratch, it will inevitably lead to overfitting. Apparently face recognition and facial diagnosis are related. Since the labelled data in the area of face recognition is much more, transfer learning technology comes into our view. In traditional learning, we train separate isolated models on specific datasets for different tasks. Transfer learning is to apply the knowledge gained while solving one problem to a different but related problem. According to whether the feature spaces of two domains are same or not, it can be divided into homogeneous transfer learning and heterogeneous transfer learning [38]. In our task, it belongs to homogeneous transfer learning. Deep transfer learning refers to transfer knowledge by deep neural networks. Thus, transfer learning makes it possible that identifying diseases from 2D face images by deep learning technique to provide a non-invasive and convenient way to realize early diagnosis and disease screening. In this paper, the next four diseases introduced and the corresponding health controls are selected to perform the validation.

Thalassemia is a genetic disorder of blood caused by abnormal hemoglobin production, and it is one of the most common inherited blood disorders in the world. It is particularly common in people of Mediterranean, the Middle East, South Asian, Southeast Asian and Latin America. Since thalassemia can be fatal in early childhood without ongoing treatment, early diagnosis is vital for thalassemia. There are two different types of thalassemia: alpha (α) and beta (β). Beta-thalassemia is caused by mutations in the HBB gene which provides instructions for making a protein named beta-globin on chromosome 11, and is inherited in an autosomal recessive fashion. It is estimated that the annual incidence of symptomatic beta-thalassemia individuals worldwide is 1 in 100,000 [35]. According to medical research [13], beta-thalassemia can result in bone deformities, especially in the face. The typical characteristics of beta-thalassemia on the face include small eye openings, epicanthal folds, low nasal bridge, flat midface, short nose, smooth philtrum, thin upper lip and underdeveloped jaw (see Figure 1(a)). Hyperthyroidism is a common endocrine disease caused by excessive amounts of the thyroid hormones T3 and T4 which can regulate the body’s metabolism by various causes. The estimated average prevalence rate is 0.75% and the incidence rate is 51 per 100,000 persons per year by the meta-analysis [14]. If it is not treated early, hyperthyroidism will cause a series of serious complications and even threaten the patient’s life. The typical characteristics of hyperthyroidism on the face include thinning hair, shining and protruding or staring eyes, increased ocular fissure, less blinking, nervousness, consternation and fatigue.

The characteristic hyperthyroidism-specific face is shown as Figure 1(b). Down syndrome (DS) is a genetic disorder caused by the trisomy of chromosome 21. DS occurs in about one per one thousand the newborns each year. The common symptoms include physical growth delays, mild to moderate intellectual disability, and the special face. The typical characteristics of DS [15] on the face include larger head compared to the face, upward-slant of palpebral fissures, epicanthal folds, Brushfield spots, low-set small folded ears, flattened nasal bridge, short broad nose with depressed root and full tip, small oral cavity with broadened alveolar ridges and narrow palate, small chin and short neck. The characteristic DS-specific face is shown as Figure 1(c). Leprosy (also known Hansen’s disease) caused by a slow-growing type of bacteria named Mycobacterium leprae is an infectious disease. If the leper doesn’t accept timely treatment, leprosy will cause losing feelings of pain, weakness and poor eyesight. According to the World Health Organization, there are about 180,000 people infected with leprosy most of which are in Africa and Asia until 2017. The typical characteristics of leprosy [16] on the face include granulomas, hair loss, eye damage, pale areas of skin and facial disfigurement (e.g. loss of nose). The characteristic leprosy-specific face is shown as Figure 1(d). Identifying above diseases from uncontrolled 2D face images by deep learning technique has provided a good start for a non-invasive and convenient way to realize early diagnosis and disease screening. In this paper, our contributions are as follows: (1) We definitely propose using deep transfer learning from face recognition to perform the computer-aided facial diagnosis on various diseases. (2) We validate deep transfer learning methods for single and multiple diseases identification on a small dataset. (3) Through comparison, we find some rules for deep transfer learning from face recognition to facial diagnosis. The rest of this paper is organized as follows: Chapter 2 reviews the related work of computer-aided facial diagnosis. Chapter 3 describes our proposed methods and their implementations. Our experimental results are analyzed and discussed in Chapter 4. Chapter 5 makes a conclusion.

  1. RELATED WORK

Pan and Yang categorize transfer learning approaches into instance based transfer learning, feature based transfer learning, parameter based transfer learning, and relation based transfer learning [38]. Here we list some classical researches of each category. Instance based transfer learning is to reuse the source domain data by reweighting. Dai et al. presented TrAdaBoost to increase the instance weights that are beneficial to the target classification task and reduce the instance weights that are not conducive to the target classification task [45]. Tan et al. proposed a Selective Learning Algorithm (SLA) to solve the Distant Domain Transfer Learning (DDTL) problem with the supervised autoencoder as a base model for knowledge sharing among different domains [46]. As for feature based transfer learning, it is to encode the knowledge to be transferred into the learned feature representation to reduce the gap between the source domain and the target domain. Pan et al. presented transfer component analysis (TCA) using Maximum Mean Discrepancy (MMD) as the measurement criterion to minimize the data distribution difference in different domains [47]. Long et al. presented Joint Adaptation Networks (JAN) to align the joint distributions based on a joint maximum mean discrepancy (JMMD) criterion [48]. Regarding Parameter based transfer learning is to encode the transferred knowledge into the shared parameters. It is widely used in the medical application. Razavian et al. found that CNNs trained on large-scale datasets (e.g. ImageNet) are also pretty good feature extractors [49]. Esteva et al. used Google Inception v3 CNN architecture pretrained on the ImageNet dataset (1.28 million images over 1,000 generic object classes) and fine-tuned on their own dataset of 129,450 skin lesions comprising 2,032 different diseases [50]. The high accuracy demonstrates an artificial intelligence capable of classifying skin cancer with a level of competence comparable to dermatologists. Yu et al. used a voting system based on the output of three CNNs for medical images modality classification [51]. They fixed earlier layers of CNNs for reserving generic features of natural images, and trained high-level portion for medical image features. Shi et al. used a deep CNN based transfer learning method for pulmonary nodule detection in CT slices [52]. Raghu et al. demonstrated feature-independent benefits of transfer learning for better weight scaling and convergence speedups in medical imaging [53]. Shin et al. evaluated CNN architectures, dataset characteristics and transfer learning for thoraco-abdominal lymph node (LN) detection and interstitial lung disease (ILD) classification [54]. Besides, relation based transfer learning is to transfer the relationship among the data in the source and target domains. Davis and Domingos utilized Markov logic to discover properties of predicates including symmetry and transitivity, and relations among predicates [55]. In the following part, we review the previous researches on computer-aided facial diagnosis which are not many. Zhao et al. [15], [17], [18] used traditional machine learning methods for Down syndrome (DS) diagnosis with face images. Schneider et al. [19] performed detection of acromegaly by face classification which applied texture and geometry two principles to compare graphs for similarity. Kong et al. [20] performed detection of acromegaly from facial photographs by using the voting method to combine the predictions of basic estimators including Generalized Linear Models (GLM) [31], K-Nearest Neighbors (KNN), Support Vector Machines (SVM), CNN, and Random Forests (RF). Shu et al. [21] used eight extractors to extract texture features from face images and applied KNN and SVM classifiers to detect Diabetes Mellitus (DM).

Hadj-Rabia et al. [22] detected the X-linked hypohidrotic ectodermal dysplasia (XLHED) phenotype from facial images with the Facial Dysmorphology Novel Analysis (FDNA) Software. Kruszka et al. [23] extracted 126 facial features including both geometric and texture biomarkers and used SVM classifiers to make 22q11.2 DS diagnoses. All the researches above [15], [17]–[23] performed binary classification with good results on the detection of one specific disease. But datasets of patients for testing are small comparing with ones of other applications. And most of them used handcraft features and traditional machine learning techniques. Boehringer et al. [24] achieved an over 75.7% classification accuracy for a computer-based diagnosis among the 10 syndromes by linear discriminant analysis (LDA) [32]. Gurovich et al. [25] developed a facial analysis framework named DeepGestalt which is trained with over 26,000 patient cases by fine-tuning a deep convolutional neural network (DCNN) to quantify similarities to different genetic syndromes. However, the multiclass classification tasks [24], [25] in facial diagnosis are with low top-1 accuracies, which are 75.7% and 60% correspondingly. Table 1 gives a brief summary of previous studies.

  1. MATERIALS AND METHODS

In this section, we describe the technology used in the method. For getting a better performance on the disease detection, sometimes we need a pre-processing procedure to remove interference factors to generate frontalized face images with a fixed size for the CNN input so that the performance of facial diagnosis can be improved. After getting the pre-processed inputs, we apply two strategies of deep transfer learning methods.

  1. DATASET

The Disease-Specific Face (DSF) dataset [9] used includes disease-specific face images which are collected from professional medical publications, medical forums, medical websites and hospitals with definite diagnostic results. In the task, there are totally 350 face images (JPG files) in the dataset, and there are 70 images in each type of disease-specific faces described in Chapter 1. Generally the ratio of training data and testing data is from 2:1 to 4:1. In our experiments with the small dataset, the ratio is set as 4:3 for the efficient evaluation. Table 2 shows the statistics of the races distinguished by eyes of face images in the experiments.

  • PRE-PROCESSING

 In the generally pre-processing procedure, we perform face detection on the original 2D face images by a face detector in OpenCV [26] which is based on Histogram of Oriented Gradients (HOG) features and a linear SVM classifier. The result of face detection is a bounding box containing the face located. Then, with the help of the Dlib library, we extract 68 facial landmarks [58] which are located on eyebrows, eyes, jaw lines, bridge and bottom of nose, edges of lips and chin to get the coordinate information. Next, with the help of 68 facial landmarks extracted we perform face alignment by using the affine transformation containing a series of transformations such as translation, rotation and scaling. Finally, the frontalized face image is cropped and resized according to the CNN used.

  • DEEP TRANSFER LEARNING

Training a CNN which is end to end learning from scratch will inevitably lead to over-fitting since that the training data is generally insufficient for the task of facial diagnosis. Transfer learning is applying the knowledge gained while solving one problem to a different but related problem. In the transfer learning problem [33], generally we let Ds indicate the source domain, Dt indicate the target domain and X be the feature space domain. H is assumed to be a hypothesis class on X , and I(h) is the set for characteristic function h ∈ H. The definition of H-divergence between Ds and Dt which is used to estimate divergence of unlabeled data is:

where Pr indicates the probability distribution. Furthermore, the relationship between errors of target domain and source domain can be calculated as:

where us and ut are unlabeled samples from Ds and Dt respectively. For briefly, the difference in error between source domain and task domain is bounded as:

where dH1H indicates the distance of symmetric difference hypothesis space H1H. The equations above have proved that transfer learning from different domains is mathematically effective [34]. Deep transfer learning (DTL) [38], [39] is to transfer knowledge by pretrained deep neural network which originally aims to perform facial verification and recognition in this paper. Thus the source task is face recognition and verification, and the target task is facial diagnosis. In this case, the feature spaces of the source domain and target domain are same while the source task and the target task are different but related. The similarity of two tasks motivates us to use deep transfer learning from face recognition to solve facial diagnosis problem with a small dataset. If divided according to transfer learning scenarios, it belongs to inductive transfer learning. If divided according to transfer learning methods, it belongs to parameter based transfer learning. In this section, two main deep transfer learning strategies [40], [41] are applied to perform comparison. In the main experiment, DCNN models pretrained by VGG-Face dataset [27] and ImageNet dataset [42] are compared with traditional machine learning methods. VGG-Face dataset contains 2.6M images over 2.6K people for face recognition and verification, and ImageNet dataset contains more than 14M images of 20K categories for visual object recognition. The pretrained CNN is for end-to-end learning so that it can extract high-level features automatically. Since deep transfer learning is based on the fact that CNN features are more generic in early layers and more original dataset-specific in later layers, operation should be performed on the last layers of DCNN models. The diagram of facial diagnosis by deep transfer learning is shown in Figure 2. The implementation is based on Matlab (version: 2017b) with its CNNs toolbox for computer vision applications named MatConvNet (version: 1.0-beta25). NVIDIA CUDA toolkit (version: 9.0.176) and its library CuDNN (version: 7.4.1) are applied for GPU (model: Nvidia GeForce GTX 1060) accelerating.

  1. DTL1: FINE-TUNING THE PRETRAINED CNN MODEL

In this section, we replace the final fully connected layer of the pretrained CNN by initializing the weight. When fine-tuning the CNN (see Pseudocode 1), we calculate activation value through forward propagation of the convolutional layer as:

where a indicates input feature map of some layer, and k indicates its corresponding kernel. σ is defined as:

Therefore, the output value of convolution operation is calculated as f (c l u,v ) in which f is the activation function. When updating the weights, we calculate error term through back propagation of the convolutional layer as:

where f , same with above, represents the activation function, J represents the cost function, (W, b) are the parameters and

(x, y) are the training data and label pairs. Since the pretrained model has already converged on the original training data, a small learning rate of 5 × 10⁻⁵ is utilized. Weight Decay for avoiding overfitting to a certain extent is set as 5 × 10⁻⁴ , and momentum for accelerating convergence in mini-batch gradient descent (SGD) is set as 0.9. Here we take VGG-16 model also named VGG-Face as an example, which is the best case in the main experiment. A softmax loss layer is added for retraining by 100 epochs initially. Figure 3 containing three indicators Objective, Top-1 error and Top-3 error shows the process of fine-tuning the pretrained VGG-Face for the multiclass classification task. Objective is the sum loss of all samples in a batch. The loss can be calculated as:

where yi refers to the i th true classification result, pi represents the i th output of the softmax function, and zi represents the i th output of the convolutional neural network. The Top-1 error refers to the percentage of the time that the classifier did not correctly predict the class with the highest score. The Top-3 error refers to the percentage of the time that the classifier did not include the correct class among its top 3 guesses. As it can be seen from Figure 3, all three indicators converge after retraining about 11 epochs, which indicates fine-tuning is successful and effective. However, the validation error is higher than the training error, which is because of the limitation of the fine-tuning strategy on the small dataset. As shown in Figure 3, after 24 epochs the validation top-1 error rises while the training error doesn’t, which indicates over-fitting may occur. So we saved the fine-tuned CNN model after retraining 24 epochs for testing. The early stopping technique is used here. The softmax layer is used for classification, which is consistent with the pretrained model. Time complexity is the number of calculations of one model/algorithm, which can be measured with floating point operations (FLOPs). In our estimations, the Multiply-Accumulate Operation (MAC) is used as the unit of FLOPs. In CNNs, time complexity of a single convolutional layer can be estimated as:

where M is the side length of the feature map output by each kernel, K is the side length of each kernel, and C represents the number of corresponding channels [59]. Thus, the overall time complexity of convolutional neural networks can be estimated as:

The FLOPs of the fully connected layers can be estimated by I · O where I indicates input neuron numbers and O indicates output neuron numbers. I corresponds to Cl−1 and O corresponds to Cl in the above formula. Because pretrained models for object and face recognition have a larger number of categories, the time complexity of adapted models by DTL1 in our task is smaller than the original corresponding pretrained model.

  • DTL2: CNN AS FIXED FEATURE EXTRACTOR

In this section, the CNN is used as a feature extractor directly for the smaller dataset (see Pseudocode 2). During training process for facial diagnosis, we only want to utilize the partial weighted layers of the pretrained CNN model to extract features, but not to update the weights of it. As the architect Ludwig Mies van der Rohe said, ‘‘Less is more’’. We select the linear kernel for the SVM [37] model to do classification in this strategy, because the dimension of the input feature vectors is much larger than the number of samples. For the reason that CNN features are more original dataset specific in the last layers, we directly extract features of the layer which is located before the final fully connected layer of pretrained DCNN models, and then train a linear SVM classifier leveraging the features extracted as:

where C which is a hyper-parameter indicates a penalty factor, and (xi, yi) represents the training data. After the training process, we could obtain the linear SVM model trained to perform testing. During the training phase, the time complexity of SVM is different in different situations, namely whether most support vectors are at the upper bound or not, and depending on the ratio of the number of vectors and the number of training points. During the testing phase, the time complexity of SVM is O(M · Ns) where M is the number of operations required by the corresponding kernel, and Ns is the number of support vectors. For a linear SVM classifier, the algorithm complexity is O(dl · Ns) where dl is the dimension of input vectors [56]. In our tasks, Ns is larger than the number of output neurons of CNN final fully connected layers in DTL1, while generally smaller than it in the original corresponding pretrained models.

  1. RESULTS AND DISCUSSIONS

In this section, we perform the experiments on two tasks of facial diagnosis by two strategies of deep transfer learning including fine-tuning abbreviated as DTL1 and using CNN as a feature extractor abbreviated as DTL2. The deep learning models pretrained for object detection and face recognition are selected for comparison. In addition, we compare the results with traditional machine learning methods using the hand-crafted feature that is Dense Scale Invariant Feature Transform (DSIFT) [28]. DSIFT, which is often used in object recognition, performs Scale Invariant

Feature Transform (SIFT) on a dense gird of locations of the image at a certain scale and orientation. The SVM algorithm for its good performance in few-shot learning is used as the classifier for Bag of Features (BOF) models with DSIFT descriptors. Two cases of facial diagnosis are designed in this paper. One is the detection of beta-thalassemia, which is a binary classification task. The other one is the detection of four diseases which are beta-thalassemia, hyperthyroidism, Down syndrome and leprosy with the healthy control, which is a multiclass classification task and more challenging.

  1. SINGLE DISEASE DETECTION (BETA-THALASSEMIA): A BINARY CLASSIFICATION TASK

In practical, we usually need to perform detection or screening on one specific disease. In this case, we only use 140 images of the dataset which are 70 betathalassemia-specific face images and 70 images for healthy control. 40 of each type images are for training, and 30 of each type images are for testing. It is a binary classification task. By comparing all selected machine learning methods (see Table 3), we find that the best overall top-1 accuracies

can be achieved by using the strategies of deep transfer learning on the VGG-Face model (VGG-16 pretrained on the VGG-Face dataset). Furthermore, applying DTL2: CNN as a feature extractor can get a better accuracy of 95.0% than using DTL1: fine-tuning in this task, which is indicated by Figure 4. Figure 4 shows the confusion matrices of DTL1 and DTL2 on the VGG-Face model in this task. D1 represents the beta-thalassemia-specific face, and N0 represents the healthy control. The row in the confusion matrix indicates the predicted classes, and the column in the confusion matrix indicates the actual classes. In detail, two of thirty testing images for each type, false positives and false negatives, are misclassified by DTL1, which leads to an accuracy of 93.3%. For DTL2, thirty images belonging to the type of beta-thalassemia in actual, true positives, are all classified correctly. On the other hand, three of thirty images, false positives, are belonging to the healthy control in actual, but classified as the beta-thalassemia-specific face. Figure 5 shows the receiver operating characteristic (ROC) curves of the VGG-Face model by DTL1 and DTL2. The blue dotted line indicates the performance of DTL1, and the red solid line indicates the performance of DTL2. The Areas Under ROC curves (AUC) calculated are 0.969 and 0.978 correspondingly.

For comparison, deep learning models pretrained such as AlexNet, VGG16 and ResNet are used. In addition, traditional machine learning methods extracting DSIFT features on the face image and predicting with a linear or nonlinear SVM classifier [29] are selected. Five indicators that are accuracy, precision, sensitivity, specificity and F1-score which is a weighted average of the precision and sensitivity are selected to evaluate the performance of models. The indicator of FLOPs spent for forward pass is estimated to evaluate the time complexity of models. Table 3 lists the results of both traditional machine learning methods and fine-tuning deep learning models pretrained on the ImageNet and VGG-Face dataset in this task. From the results, we find that the performance by traditional machine learning methods is close to the performance of fine-tuning (DTL1) deep learning models pretrained on ImageNet. However, the performance of fine-tuning (DTL1) the deep learning models pretrained on VGG-Face is overall better than ones pretrained on ImageNet, which is reasonable. Because the source domain of VGG-Face is nearer to DSF dataset than ImageNet. Table 4 lists the results of CNN as a feature extractor on the pretrained deep learning models (DTL2). Applying DTL2: CNN as a feature extractor can get an overall better performance than traditional machine learning methods and DTL1. However, deep learning models pretrained on VGG-Face seem to behave not necessarily better than deep learning models pretrained on ImageNet in this strategy. It will be investigated further in the next experiment.

  • VARIOUS DISEASES DETECTION: A MULTICLASS CLASSIFICATION TASK

In practical, that we perform various diseases detection or screening at one time could greatly increase efficiency. For evaluating the algorithm further, in this case there are totally 350 images in the task dataset, and there are 70 images for each type of faces. For the training process, totally 200 images (40 images of each type) are used. For the testing process, totally 150 images (30 images of each type) are used. It is a multiclass classification task. By comparing

all selected machine learning methods, we find that the best overall top-1 accuracies can be achieved by using the strategies of deep transfer learning on the VGG-Face model again. Furthermore, applying DTL2: VGG-Face as a feature extractor can get a better accuracy of 93.3% than using DTL1: fine-tuning in this task, which is indicated by Figure 6. Figure 6 shows the confusion matrices of DTL1 and DTL2 on the VGG-Face model in this task. D1 represents the beta-thalassemia-specific face, D2 represents the hyperthyroidism-specific face, D3 represents the DS-specific face, D4 represents the leprosy-specific face and N0 represents the healthy control. The row in the confusion matrix indicates the predicted classes, and the column in the confusion matrix indicates the actual classes. From the Figure 6(b), four of thirty images are belonging to the hyperthyroidism-specific face in actual, but classified as other types, which indicates it is relatively difficult for the classifier to recognize hyperthyroidism from face images. For recognizing beta-thalassemia, Down syndrome and leprosy, the classifier has a very good accuracy. Figure 6(a) of DTL1 also shows a low accuracy on recognizing hyperthyroidism. Table 5 lists the results of traditional machine learning methods and deep learning methods in the multiclass classification task as described before. Since the multiclass classification task is more difficult than the binary classification task before, the accuracies of machine learning models decrease generally. The results by deep transfer learning methods are much better than the results by traditional machine learning methods in this task, which is as expected. And deep learning models pretrained on VGG-Face behave generally better than deep learning models pretrained on ImageNet in both strategies. The performance of DTL2: CNN as a feature extractor is overall better than that of DTL1:

Fine-tuning again, which probably is due to the relatively small dataset. On the basis of applying DTL2, for exploring a better performance by deep transfer learning, we investigate the performance of ResNet50 and SE-ResNet50 [36] models pretrained on MS-Celeb-1M [43] and VGGFace2 [44]. MS-Celeb-1M is a widely used dataset of roughly 10 million photos from 100,000 individuals for face recognition. VGGFace2 is a large-scale dataset containing more than 3.3 million face images over 9K identities for face recognition. Table 6 lists the results of ResNet50 and SE-ResNet50 models pretrained on the different datasets. SE-ResNet50 has more complex structure but does not get better results than ResNet50 here, which accords with the fact that ‘‘VGG-Face’’ model achieves the best results in our experiments. The results indicate pretraining on more task-related datasets can improve the performance in this task. The ResNet50 pretrained on MS-Celeb-1M and finetuned on VGGFace2 improves its accuracy from 86.7% (ImageNet) to 92.7% which is closest to the best result. In addition, clinicians from Jiangsu Province Hospital and Zhongda Hospital Affiliated To Southeast University are invited to perform the detection on the same task to get an average accuracy of 84.5%, which is similar with the accuracy of the specialists published before [23]. DTL2: CNN as a feature extractor still outperforms clinicians, which is promising. Regarding the time complexity (see Table 3-6), as mentioned in the theoretical part, the time complexity of DTL1 and DTL2 are both smaller than that of the corresponding pretrained model, and the time complexity of DTL2 is a bit larger than that of DTL1. Since the FLOPs of CNN models are almost more than a few hundred millions now, the difference in FLOPs values of the adapted model and its corresponding pretrained model shown in tables is not obvious. From these experiments, we can conclude that the performance by deep learning methods are overall better than the results by traditional machine learning methods as expected. The difference is more expressive for the multiclass classification task. In the case of the small dataset of facial diagnosis, DTL2: CNN as a feature extractor is more appropriate than DTL1: Fine-tuning. Furthermore, it is because of the similarity between the target domain and the source domain of deep learning models pretrained for face recognition that the better performance can be reached by deep transfer learning methods. Deep learning models pretrained on more datasets for face recognition can achieve a better performance on facial diagnosis by deep transfer learning.

  • CONCLUSION

More and more studies have shown that computer-aided facial diagnosis is a promising way for disease screening and detection. In this paper, we propose deep transfer learning from face recognition methods to realize computer-aided facial diagnosis definitely and validate them on single disease and various diseases with the healthy control. The experimental results of above 90% accuracy have proven that CNN as a feature extractor is the most appropriate deep transfer learning method in the case of the small dataset of facial diagnosis. It can solve the general problem of insufficient data in the facial diagnosis area to a certain extent. In future, we will continue to discover deep learning models to perform facial diagnosis effectively with the help of data augmentation methods. We hope that more and more diseases can be detected efficiently by face photographs.

ACKNOWLEDGMENT

The Visual Information Security (VIS) Team supports us theoretically and technically. The authors would like to thank all the members of VIS team. They also would like to thank Professors Urbano José Carreira Nunes, Helder Jesus Araújo and Rui Alexandre Matos Araújo for their valuable suggestions.

REFERENCES

[1] P. U. Unschuld, Huang Di Nei Jing Su Wen: Nature, Knowledge, Imagery in an Ancient Chinese Medical Text: With an Appendix: The Doctrine of the Five Periods and Six Qi in the Huang Di Nei Jing Su Wen. Univ of California Press, 2003.

[2] A. Krizhevsky, I. Sutskever, and G. E. Hinton, ‘‘Imagenet classification with deep convolutional neural networks,’’ in Proc. Adv. Neural Inf. Process. Syst., 2012, pp. 1097–1105.

[3] C. Szegedy, W. Liu, Y. Jia, P. Sermanet, S. Reed, D. Anguelov, D. Erhan, V. Vanhoucke, and A. Rabinovich, ‘‘Going deeper with convolutions,’’ in Proc. IEEE Conf. Comput. Vis. Pattern Recognit. (CVPR), Jun. 2015, pp. 1–9.

[4] K. Simonyan and A. Zisserman, ‘‘Very deep convolutional networks for large-scale image recognition,’’ 2014, arXiv:1409.1556. [Online]. Available: http://arxiv.org/abs/1409.1556

[5] K. He, X. Zhang, S. Ren, and J. Sun, ‘‘Deep residual learning for image recognition,’’ in Proc. IEEE Conf. Comput. Vis. Pattern Recognit. (CVPR), Jun. 2016, pp. 770–778.

[6] C. Szegedy, S. Ioffe, V. Vanhoucke, and A. A. Alemi, ‘‘Inception-v4, inception-resnet and the impact of residual connections on learning,’’ in Proc. 31st AAAI Conf. Artif. Intell., 2017, pp. 1–12.

[7] F. Schroff, D. Kalenichenko, and J. Philbin, ‘‘FaceNet: A unified embedding for face recognition and clustering,’’ in Proc. IEEE Conf. Comput. Vis. Pattern Recognit. (CVPR), Jun. 2015, pp. 815–823.

[8] Y. Taigman, M. Yang, M. Ranzato, and L. Wolf, ‘‘DeepFace: Closing the gap to human-level performance in face verification,’’ in Proc. IEEE Conf. Comput. Vis. Pattern Recognit., Jun. 2014, pp. 1701–1708.

[9] B. Jin, ‘‘Disease-specific faces,’’ IEEE Dataport, 2020. Accessed: Jun. 29, 2020. [Online]. Available: http://dx.doi.org/10.21227/ rk2v-ka85

[10] J. Liu, Y. Deng, T. Bai, Z. Wei, and C. Huang, ‘‘Targeting ultimate accuracy: Face recognition via deep embedding,’’ 2015, arXiv:1506.07310. [Online]. Available: http://arxiv.org/abs/1506.07310

[11] J. Fanghänel, T. Gedrange, and P. Proff, ‘‘The face-physiognomic expressiveness and human identity,’’ Ann. Anatomy-Anatomischer Anzeiger, vol. 188, no. 3, pp. 261–266, May 2006.

[12] B. Zhang, X. Wang, F. Karray, Z. Yang, and D. Zhang, ‘‘Computerized facial diagnosis using both color and texture features,’’ Inf. Sci., vol. 221, pp. 49–59, Feb. 2013.

[13] E. S. J. A. Alhaija and F. N. Hattab, ‘‘Cephalometric measurements and facial deformities in subjects with -thalassaemia major,’’ Eur. J. Orthodontics, vol. 24, no. 1, pp. 9–19, Feb. 2002.

[14] P. N. Taylor, D. Albrecht, A. Scholz, G. Gutierrez-Buey, J. H. Lazarus, C. M. Dayan, and O. E. Okosieme, ‘‘Global epidemiology of hyperthyroidism and hypothyroidism,’’ Nature Rev. Endocrinol., vol. 14, no. 5, pp. 301–316, 2018.

[15] Q. Zhao, K. Rosenbaum, R. Sze, D. Zand, M. Summar, and M. G. Linguraru, ‘‘Down syndrome detection from facial photographs using machine learning techniques,’’ Proc. SPIE, vol. 8670, Feb. 2013, Art. no. 867003.

[16] E. Turkof, B. Khatri, S. Lucas, O. Assadian, B. Richard, and E. Knolle, ‘‘Leprosy affects facial nerves in a scattered distribution from the main trunk to all peripheral branches and neurolysis improves muscle function of the face,’’ Amer. J. Tropical Med. Hygiene, vol. 68, no. 1, pp. 81–88, Jan. 2003.

[17] Q. Zhao, K. Okada, K. Rosenbaum, D. J. Zand, R. Sze, M. Summar, and M. G. Linguraru, ‘‘Hierarchical constrained local model using ICA and its application to Down syndrome detection,’’ in Proc. Int. Conf. Med. Image Comput. Comput.-Assist. Intervent. Berlin, Germany: Springer, 2013, pp. 222–229.

[18] Q. Zhao, K. Okada, K. Rosenbaum, L. Kehoe, D. J. Zand, R. Sze, M. Summar, and M. G. Linguraru, ‘‘Digital facial dysmorphology for genetic screening: Hierarchical constrained local model using ICA,’’ Med. Image Anal., vol. 18, no. 5, pp. 699–710, Jul. 2014.

[19] H. J. Schneider, R. P. Kosilek, M. Günther, J. Roemmler, G. K. Stalla, C. Sievers, M. Reincke, J. Schopohl, and R. P. Würtz, ‘‘A novel approach to the detection of acromegaly: Accuracy of diagnosis by automatic face classification,’’ J. Clin. Endocrinol. Metabolism, vol. 96, no. 7, pp. 2074–2080, Jul. 2011.

[20] X. Kong, S. Gong, L. Su, N. Howard, and Y. Kong, ‘‘Automatic detection of acromegaly from facial photographs using machine learning methods,’’ EBioMedicine, vol. 27, pp. 94–102, Jan. 2018.

[21] T. Shu, B. Zhang, and Y. Y. Tang, ‘‘An extensive analysis of various texture feature extractors to detect diabetes mellitus using facial specific regions,’’ Comput. Biol. Med., vol. 83, pp. 69–83, Apr. 2017.

[22] S. Hadj-Rabia, H. Schneider, E. Navarro, O. Klein, N. Kirby, K. Huttner, L. Wolf, M. Orin, S. Wohlfart, C. Bodemer, and D. K. Grange, ‘‘Automatic recognition of the XLHED phenotype from facial images,’’ Amer. J. Med. Genet. Part A, vol. 173, no. 9, pp. 2408–2414, Sep. 2017.

[23] P. Kruszka, Y. A. Addissie, D. E. McGinn, A. R. Porras, E. Biggs, M. Share, and T. B. Crowley, ‘‘22q11. 2 deletion syndrome in diverse populations,’’ Amer. J. Med. Genetics A, vol. 173, no. 4, pp. 879–888, 2017. [24] S. Boehringer, T. Vollmar, C. Tasse, R. P. Wurtz, G. Gillessen-Kaesbach, B. Horsthemke, and D. Wieczorek, ‘‘Syndrome identification based on 2D analysis software,’’ Eur. J. Hum. Genet., vol. 14, no. 10, pp. 1082–1089, Oct. 2006.

[25] Y. Gurovich, Y. Hanani, O. Bar, G. Nadav, N. Fleischer, D. Gelbman, L. Basel-Salmon, P. M. Krawitz, S. B. Kamphausen, M. Zenker, L. M. Bird, and K. W. Gripp, ‘‘Identifying facial phenotypes of genetic disorders using deep learning,’’ Nature Med., vol. 25, no. 1, pp. 60–64, Jan. 2019.

[26] G. Bradski and A. Kaehler, Learning OpenCV: Computer Vision With the OpenCV Library. Newton, MA, USA: O’Reilly Media, 2008.

[27] O. M. Parkhi, A. Vedaldi, and A. Zisserman, ‘‘Deep face recognition,’’ in Proc. Brit. Mach. Vis. Conf., 2015, pp. 1–12. [28] J.-G. Wang, J. Li, C. Y. Lee, and W.-Y. Yau, ‘‘Dense SIFT and Gabor descriptors-based face representation with applications to gender recognition,’’ in Proc. 11th Int. Conf. Control Autom. Robot. Vis., Dec. 2010, pp. 1860–1864.

[29] C. Shan, S. Gong, and P. W. McOwan, ‘‘Robust facial expression recognition using local binary patterns,’’ in Proc. IEEE Int. Conf. Image Process., Sep. 2005. pp. II–370.

[30] D. Wu, Y. Chen, C. Xu, K. Wang, H. Wang, F. Zheng, D. Ma, and G. Wang, ‘‘Characteristic face: A key indicator for direct diagnosis of 22q11. 2 deletions in Chinese velocardiofacial syndrome patients,’’ PLoS ONE, vol. 8, no. 1, 2013, Art. no. e54404.

[31] J. Wen, Y. Xu, Z. Li, Z. Ma, and Y. Xu, ‘‘Inter-class sparsity based discriminative least square regression,’’ Neural Netw., vol. 102, pp. 36–47, Jun. 2018.

[32] J. Wen, X. Fang, J. Cui, L. Fei, K. Yan, Y. Chen, and Y. Xu, ‘‘Robust sparse linear discriminant analysis,’’ IEEE Trans. Circuits Syst. Video Technol., vol. 29, no. 2, pp. 390–403, Feb. 2019, doi: 10.1109/TCSVT.2018.2799214.

[33] S. Ben-David, J. Blitzer, K. Crammer, A. Kulesza, F. Pereira, and J. W. Vaughan, ‘‘A theory of learning from different domains,’’ Mach. Learn., vol. 79, nos. 1–2, pp. 151–175, May 2010.

[34] S. Ben-David, J. Blitzer, K. Crammer, and F. Pereira, ‘‘Analysis of representations for domain adaptation,’’ in Proc. Adv. Neural Inf. Process. Syst., 2007, pp. 137–144.

[35] R. Galanello and R. Origa, ‘‘Beta-thalassemia,’’ Orphanet J. Rare Diseases, vol. 5, no. 1, p. 11, 2010. [36] J. Hu, L. Shen, and G. Sun, ‘‘Squeeze-and-Excitation networks,’’ in Proc. IEEE/CVF Conf. Comput. Vis. Pattern Recognit., Jun. 2018, pp. 7132–7141.

[37] J. A. K. Suykens and J. Vandewalle, ‘‘Least squares support vector machine classifiers,’’ Neural Process. Lett., vol. 9, no. 3, pp. 293–300, Jun. 1999.

[38] S. J. Pan and Q. Yang, ‘‘A survey on transfer learning,’’ IEEE Trans. Knowl. Data Eng., vol. 22, no. 10, pp. 1345–1359, Oct. 2010.

[39] L. Shao, F. Zhu, and X. Li, ‘‘Transfer learning for visual categorization: A survey,’’ IEEE Trans. Neural Netw. Learn. Syst., vol. 26, no. 5, pp. 1019–1034, May 2015.

[40] D. Sarkar, A Comprehensive Hands-on Guide to Transfer Learning With Real-World Applications in Deep Learning. Medium, 2018.

[41] S. Ruder. Transfer Learning-Machine Learning’s Next Frontier. Accessed: 2017. [Online]. Available: https://ruder.io/transfer-learning/

[42] J. Deng, W. Dong, R. Socher, L.-J. Li, K. Li, and L. Fei-Fei, ‘‘ImageNet: A large-scale hierarchical image database,’’ in Proc. IEEE Conf. Comput. Vis. Pattern Recognit., Jun. 2009, pp. 248–255.

[43] Y. Guo, L. Zhang, Y. Hu, X. He, and J. Gao, ‘‘MS-Celeb-1M: A dataset and benchmark for large-scale face recognition,’’ in Proc. Eur. Conf. Comput. Vis. Cham, Switzerland: Springer, 2016, pp. 87–102.

[44] Q. Cao, L. Shen, W. Xie, O. M. Parkhi, and A. Zisserman, ‘‘VGGFace2: A dataset for recognising faces across pose and age,’’ in Proc. 13th IEEE Int. Conf. Autom. Face Gesture Recognit. (FG), May 2018, pp. 67–74.

[45] W. Dai, Q. Yang, G.-R. Xue, and Y. Yu, ‘‘Boosting for transfer learning,’’ in Proc. 24th Int. Conf. Mach. Learn. (ICML), 2007, pp. 193–200.

[46] B. Tan, Y. Zhang, S. J. Pan, and Q. Yang, ‘‘Distant domain transfer learning,’’ in Proc. 31st AAAI Conf. Artif. Intell., 2017, pp. 2604–2610.

[47] S. J. Pan, I. W. Tsang, J. T. Kwok, and Q. Yang, ‘‘Domain adaptation via transfer component analysis,’’ IEEE Trans. Neural Netw., vol. 22, no. 2, pp. 199–210, Feb. 2011.

[48] M. Long, H. Zhu, J. Wang, and M. I. Jordan, ‘‘Deep transfer learning with joint adaptation networks,’’ in Proc. 34th Int. Conf. Mach. Learn., Vol. 70, 2017, pp. 2208–2217.

[49] A. S. Razavian, H. Azizpour, J. Sullivan, and S. Carlsson, ‘‘CNN features Off-the-shelf: An astounding baseline for recognition,’’ in Proc. IEEE Conf. Comput. Vis. Pattern Recognit. Workshops, Jun. 2014, pp. 806–813.

[50] A. Esteva, B. Kuprel, R. A. Novoa, J. Ko, S. M. Swetter, H. M. Blau, and S. Thrun, ‘‘Dermatologist-level classification of skin cancer with deep neural networks,’’ Nature, vol. 542, no. 7639, pp. 115–118, Feb. 2017.

[51] Y. Yu, H. Lin, J. Meng, X. Wei, H. Guo, and Z. Zhao, ‘‘Deep transfer learning for modality classification of medical images,’’ Information, vol. 8, no. 3, p. 91, Jul. 2017.

[52] Z. Shi, H. Hao, M. Zhao, Y. Feng, L. He, Y. Wang, and K. Suzuki, ‘‘A deep CNN based transfer learning method for false positive reduction,’’ Multimedia Tools Appl., vol. 78, no. 1, pp. 1017–1033, Jan. 2019. [53] M. Raghu, C. Zhang, J. Kleinberg, and S. Bengio, ‘‘Transfusion: Understanding transfer learning for medical imaging,’’ in Proc. Adv. Neural Inf. Process. Syst., 2019, pp. 3342–3352.

 [54] H.-C. Shin, H. R. Roth, M. Gao, L. Lu, Z. Xu, I. Nogues, J. Yao, D. Mollura, and R. M. Summers, ‘‘Deep convolutional neural networks for computer-aided detection: CNN architectures, dataset characteristics and transfer learning,’’ IEEE Trans. Med. Imag., vol. 35, no. 5, pp. 1285–1298, May 2016.

[55] J. Davis and P. Domingos, ‘‘Deep transfer via second-order Markov logic,’’ in Proc. 26th Annu. Int. Conf. Mach. Learn. (ICML), 2009, pp. 217–224.

[56] C. J. C. Burges, ‘‘A tutorial on support vector machines for pattern recognition,’’ Data Mining Knowl. Discovery, vol. 2, no. 2, pp. 121–167, 1998.

[57] A. F. Abate, P. Barra, S. Barra, C. Molinari, M. Nappi, and F. Narducci, ‘‘Clustering facial attributes: Narrowing the path from soft to hard biometrics,’’ IEEE Access, vol. 8, pp. 9037–9045, 2020.

[58] V. Kazemi and J. Sullivan, ‘‘One millisecond face alignment with an ensemble of regression trees,’’ in Proc. IEEE Conf. Comput. Vis. Pattern Recognit., Jun. 2014, pp. 1867–1874. [59] P. Molchanov, S. Tyree, T. Karras, T. Aila, and J. Kautz, ‘‘Pruning convolutional neural networks for resource efficient inference,’’ 2016, arXiv:1611.06440. [Online]. Available: http://arxiv.org/abs/1611.06440